


XRP moved sharply higher in early January and broke a descending trendline that had capped price since late summer, according to the daily XRP U.S. dollar chart on Coinbase.
The breakout formed on Jan. 6 as price pushed through the downtrend resistance near the $2.35–$2.40 area.
Stay ahead in the crypto world – follow us on X for the latest updates, insights, and trends!🚀
At the latest session, XRP traded around $2.39, marking its strongest close since early November.
The move followed a steady advance over the past several days. XRP climbed from the late December low near $1.95 to about $2.39, a gain of roughly $0.44, or about 22%, in less than a week.
Even measured from early January consolidation near $2.05, price rose around 16% before breaking the trendline. As a result, short term momentum shifted clearly upward.
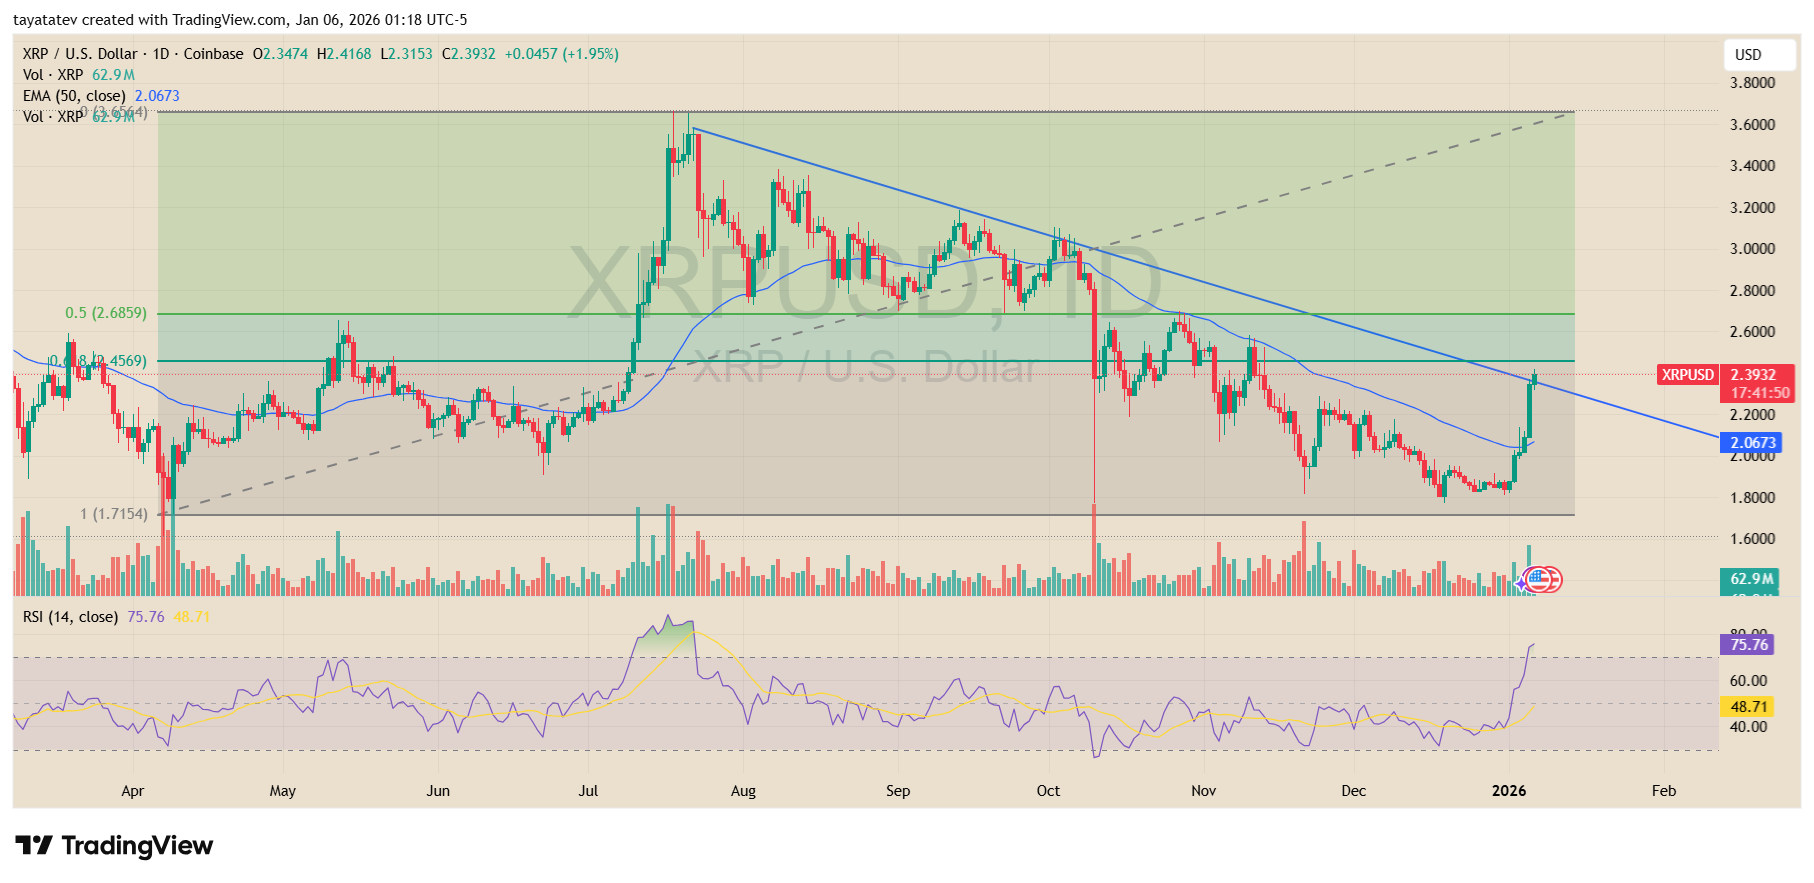
The daily chart shows price reclaiming the 50 day exponential moving average, which sits near $2.07.
XRP held above that level during the breakout, signaling improving structure after months of lower highs.
At the same time, volume expanded compared with recent sessions, confirming stronger participation during the move.
Relative strength also increased quickly. The 14 day RSI jumped into the mid 70s, its highest reading since the July rally.
That shift reflects aggressive buying pressure following a prolonged period of sideways and downward trade.
While elevated RSI often signals short term cooling risk, it also confirms that momentum has flipped in favor of buyers after the downtrend break.
From a structure perspective, the broken trendline now acts as a key reference area.
If price holds above the former resistance zone, the chart points to a broader trend change rather than a short lived bounce. The move also places XRP back inside the wider mid 2025 trading range, where prior congestion formed between roughly $2.40 and $2.80.
Taken together, the trendline break, reclaim of the 50 day EMA, and sharp momentum expansion suggest a technical reversal is underway.
After months of compression, XRP has shifted from a controlled downtrend into a higher low structure, resetting the chart as 2026 begins.
Wyckoff reaccumulation overlay frames XRP’s next decision area
Meanwhile, XRP’s daily chart on Bitstamp shows a long, sideways structure that one analyst, Charting Guy, labeled as a Wyckoff reaccumulation pattern, with phase markers such as PSY, BC, ST, “creek,” a “spring,” a “test,” and later strength signs.
The overlay argues that XRP spent much of 2025 trading inside a wide range, then used the late 2025 selloff as a shakeout before rebuilding.
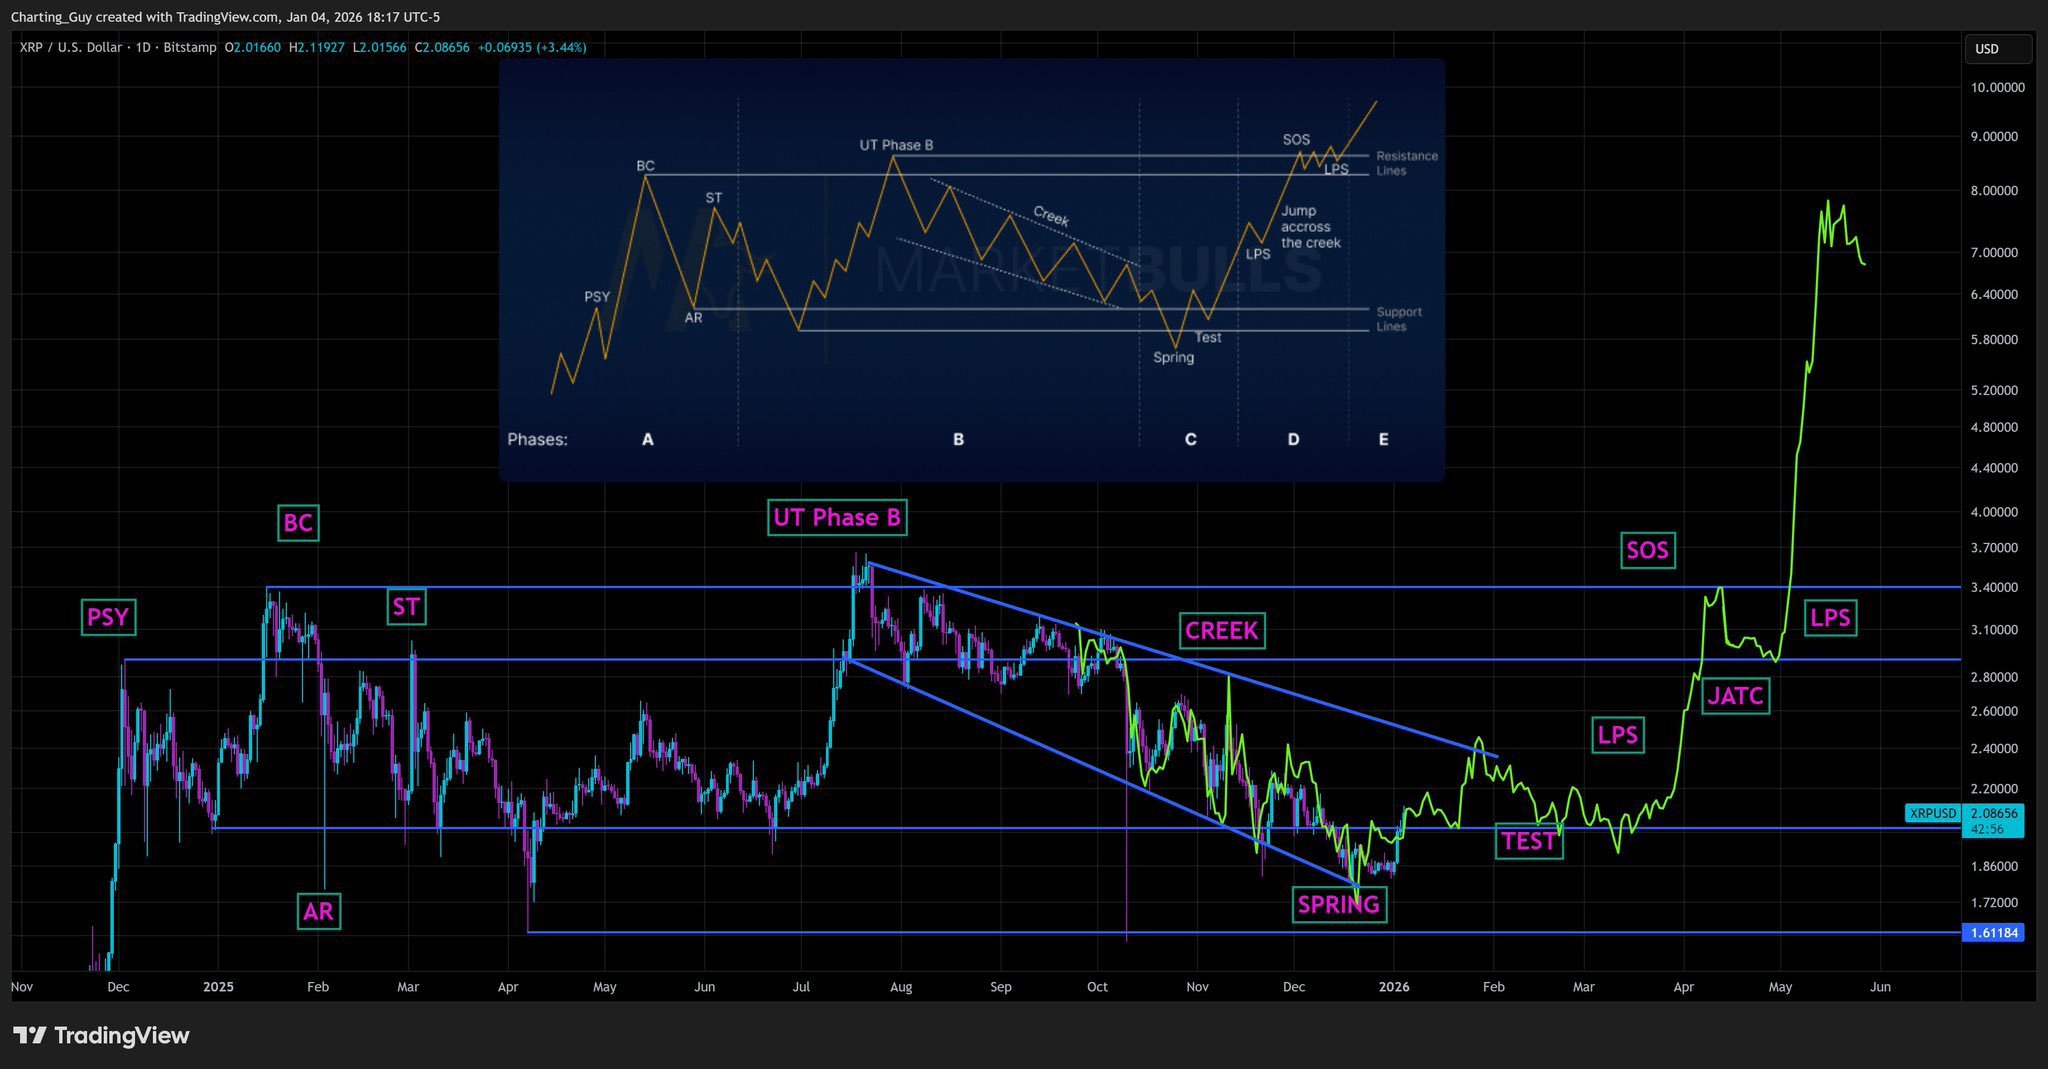
Price action on the chart shows a peak near $3.66 in July 2025, followed by a steep decline into late 2025 that pulled XRP down to roughly the $1.60–$1.70 area.
That move cut price by about half from the high, matching the post’s claim that XRP dipped around 50% from its July peak.
After that low, the chart shows XRP stabilizing, then grinding higher, which the overlay tags as a “test” after the “spring.”
The chart also highlights a descending channel that guided the downtrend from late summer into late 2025.
XRP later pushed back above that channel line and returned toward the prior range ceiling around the $2.80–$3.00 area, which the overlay calls the “creek.”
If price holds above that former resistance zone, technicians often treat it as a shift from range defense to trend recovery.
Charting Guy’s path projection extends the Wyckoff roadmap into a “jump across the creek” and later “SOS” and “LPS” zones, which, in Wyckoff terms, describe strength after resistance breaks and then a controlled pullback.
The post links that sequence to an $8 target. However, the chart itself mainly shows the structure and the key levels traders watch, especially the former range top near $3 and the prior swing areas above it.
Disclosure:This article does not contain investment advice or recommendations. Every investment and trading move involves risk, and readers should conduct their own research when making a decision.
Kriptoworld.com accepts no liability for any errors in the articles or for any financial loss resulting from incorrect information.

Tatevik Avetisyan is an editor at Kriptoworld who covers emerging crypto trends, blockchain innovation, and altcoin developments. She is passionate about breaking down complex stories for a global audience and making digital finance more accessible.
📅 Published: January 6, 2026 • 🕓 Last updated: January 6, 2026
