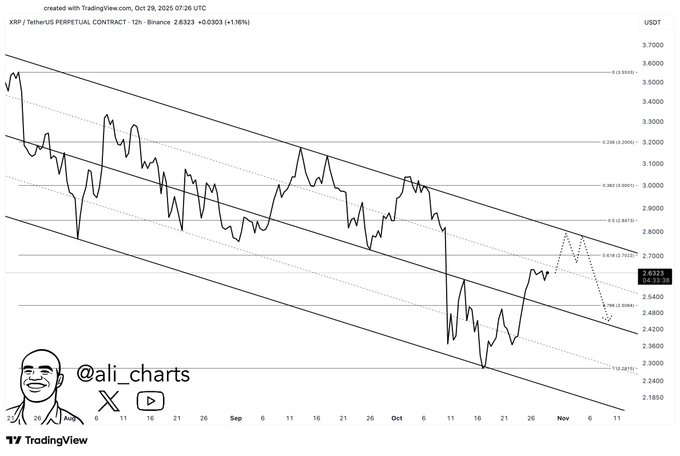
The setup shows XRP rebounding from the lower channel trendline after the recent decline. As price climbs toward mid-channel levels, momentum appears to recover, but the structure still leans bearish overall.
The $2.80 area now acts as a technical ceiling that could challenge bulls attempting a breakout.
If XRP fails to clear that resistance, it may retrace toward the midline or lower boundary of the channel, continuing its broader downtrend.
However, a clean break and sustained close above $2.80 would invalidate the bearish pattern and signal the start of a potential trend reversal.
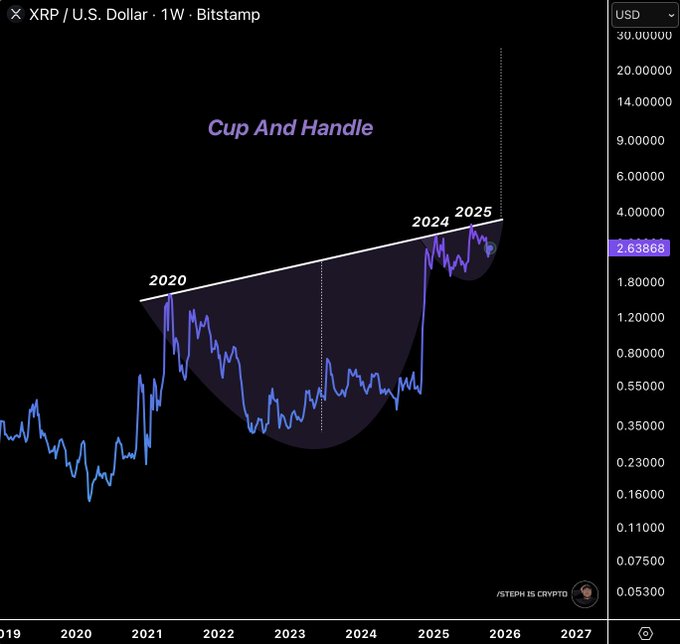
Analyst Steph_iscrypto highlights a cup-and-handle on XRP’s weekly chart spanning 2020–2025. Price built a rounded base (the cup), then pulled back into a smaller consolidation (the handle) beneath a rising neckline.
This structure signals a long accumulation phase followed by a shallow pause before potential continuation.
The neckline tracks a rising trendline connecting prior peaks into 2024–2025. As price coils inside the handle, buyers test supply near that line.
A weekly close above the neckline and the handle high would confirm the pattern and open room for trend extension. Until then, XRP remains in preparation mode.
Context matters. The handle shows lighter volatility than the cup, which often precedes breakouts.
However, failure to reclaim the neckline would keep price inside the range and invite another retest of handle support before any attempt higher.
Therefore, watch the weekly close and volume response at the neckline for confirmation.
Disclosure:This article does not contain investment advice or recommendations. Every investment and trading move involves risk, and readers should conduct their own research when making a decision.
Kriptoworld.com accepts no liability for any errors in the articles or for any financial loss resulting from incorrect information.
Tatevik Avetisyan is an editor at Kriptoworld who covers emerging crypto trends, blockchain innovation, and altcoin developments.
She is passionate about breaking down complex stories for a global audience and making digital finance more accessible.
📅 Published: October 29, 2025 • 🕓 Last updated: October 29, 2025
While the crypto market panics, Bitcoin Cash is thriving. BCH has set multiple records in February despite extreme market fear.
The network has seen increased...
Bitcoin traded near $66,505 on the 15-minute BTCUSD index chart as price continued to slide within a descending channel.
The move followed a failed bounce...