


XRP is still stuck in a sideways range on the four-hour chart, with a clear turning point near 2.08 dollars that has yet to break.
The TradingView chart from Dec. 8 shows XRP trading between support around 2.03 dollars and resistance near 2.15 dollars.
Stay ahead in the crypto world – follow us on X for the latest updates, insights, and trends!🚀
The price now sits just under 2.08 dollars, where the 50-period exponential moving average also runs, making this band the center of the current battle between buyers and sellers.
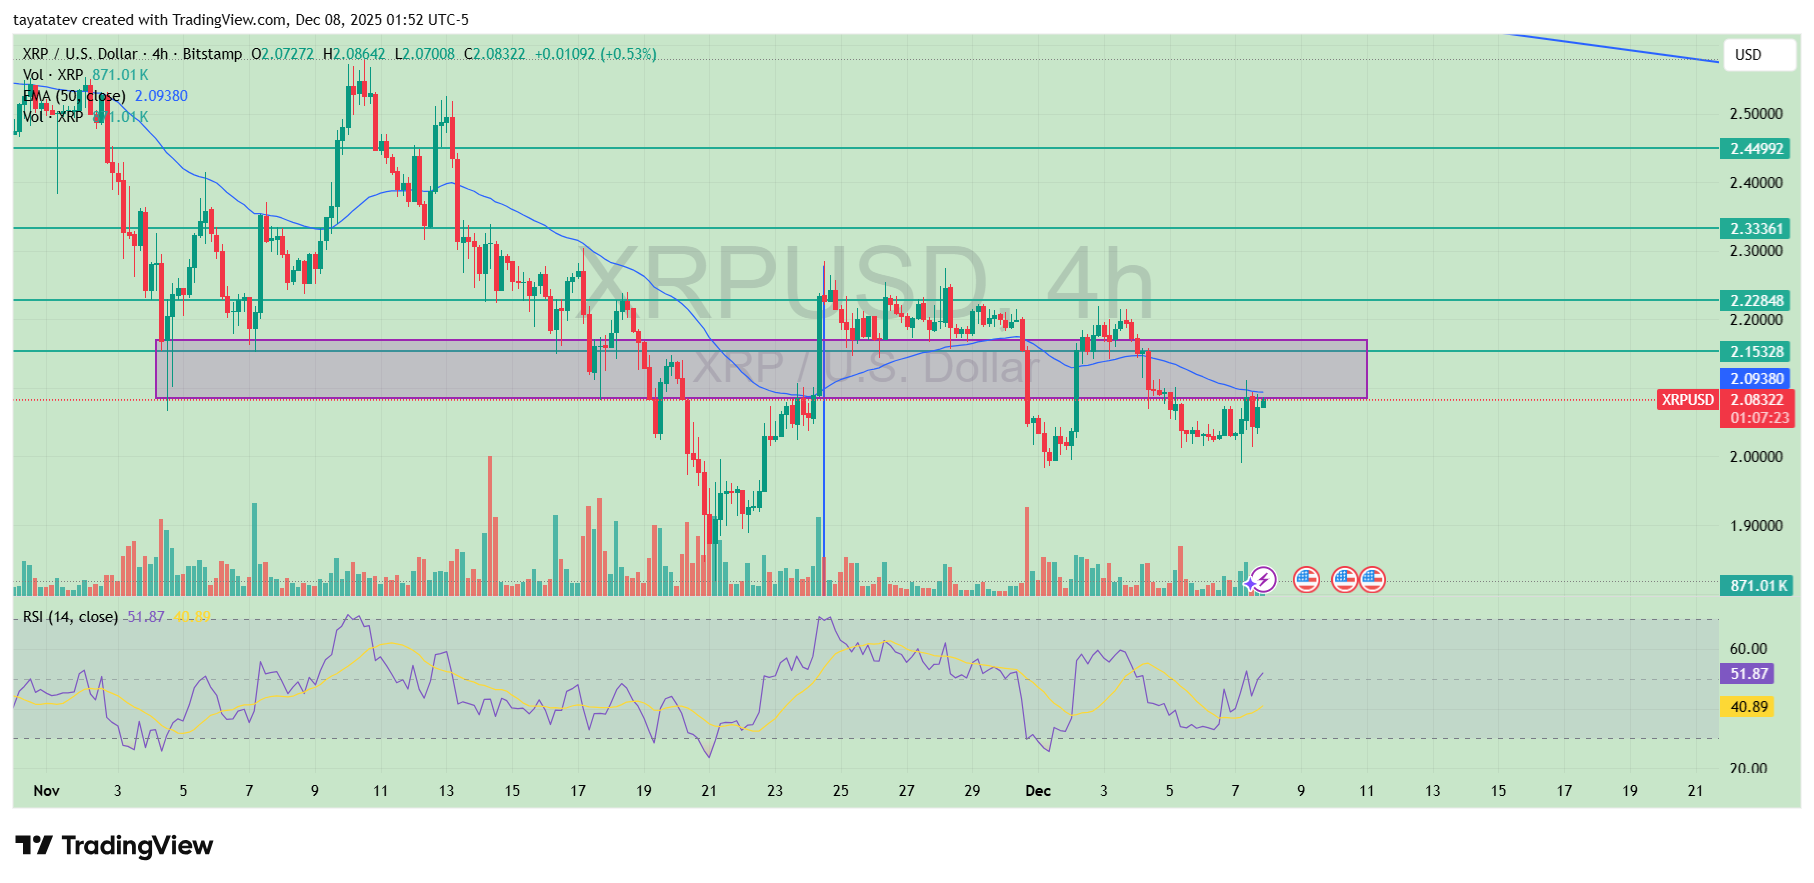
In late November, XRP slipped below the 50 EMA and lost its short-term uptrend. Price then drifted lower into the 2.03–2.05 area, where buyers started to defend the range.
Each bounce since then has run into trouble once it approached the 2.08–2.10 zone, which previously acted as support and now works as resistance.
Through the first week of December, the pattern repeated. XRP tested the floor near 2.03 dollars, then bounced back toward the middle of the range.
However, once the candles moved into the highlighted zone around 2.08 dollars, momentum faded again and new selling pressure appeared. The chart now shows several failed attempts to close above that level.
The relative strength index on the four-hour timeframe helps explain the stand-off. RSI rebounded from near 30 during the recent dip and now sits slightly above 50.
That move signals that selling pressure has eased and that buyers are more active, but it does not yet show the strong momentum usually seen at the start of a new uptrend.
Volume tells a similar story. Activity picked up when XRP bounced from the range low, then cooled as price moved back into resistance.
The lack of a clear volume spike near 2.08 dollars suggests that neither side has committed enough size to force a break.
Because of these signals, the 2.08 area has become the main line in the sand. A decisive four-hour close above 2.08 dollars, ideally with stronger volume, would be the first solid sign of a reversal.
That move would put 2.15 dollars back in play as the next barrier and could open a path toward the higher levels marked on the chart near 2.22 and 2.33 dollars.
Until XRP can clear that threshold, the market remains in consolidation, with 2.03 dollars acting as support and 2.08 dollars as the immediate test for the next direction.
Analyst Sees XRP Coiling Inside Triangle for 16 Percent Move
Ali, a market analyst known as @ali_charts, says XRP is preparing for a sizable move as it trades inside a tightening triangle on the hourly chart.
He estimates the pattern could fuel a swing of about 16 percent once price breaks out.
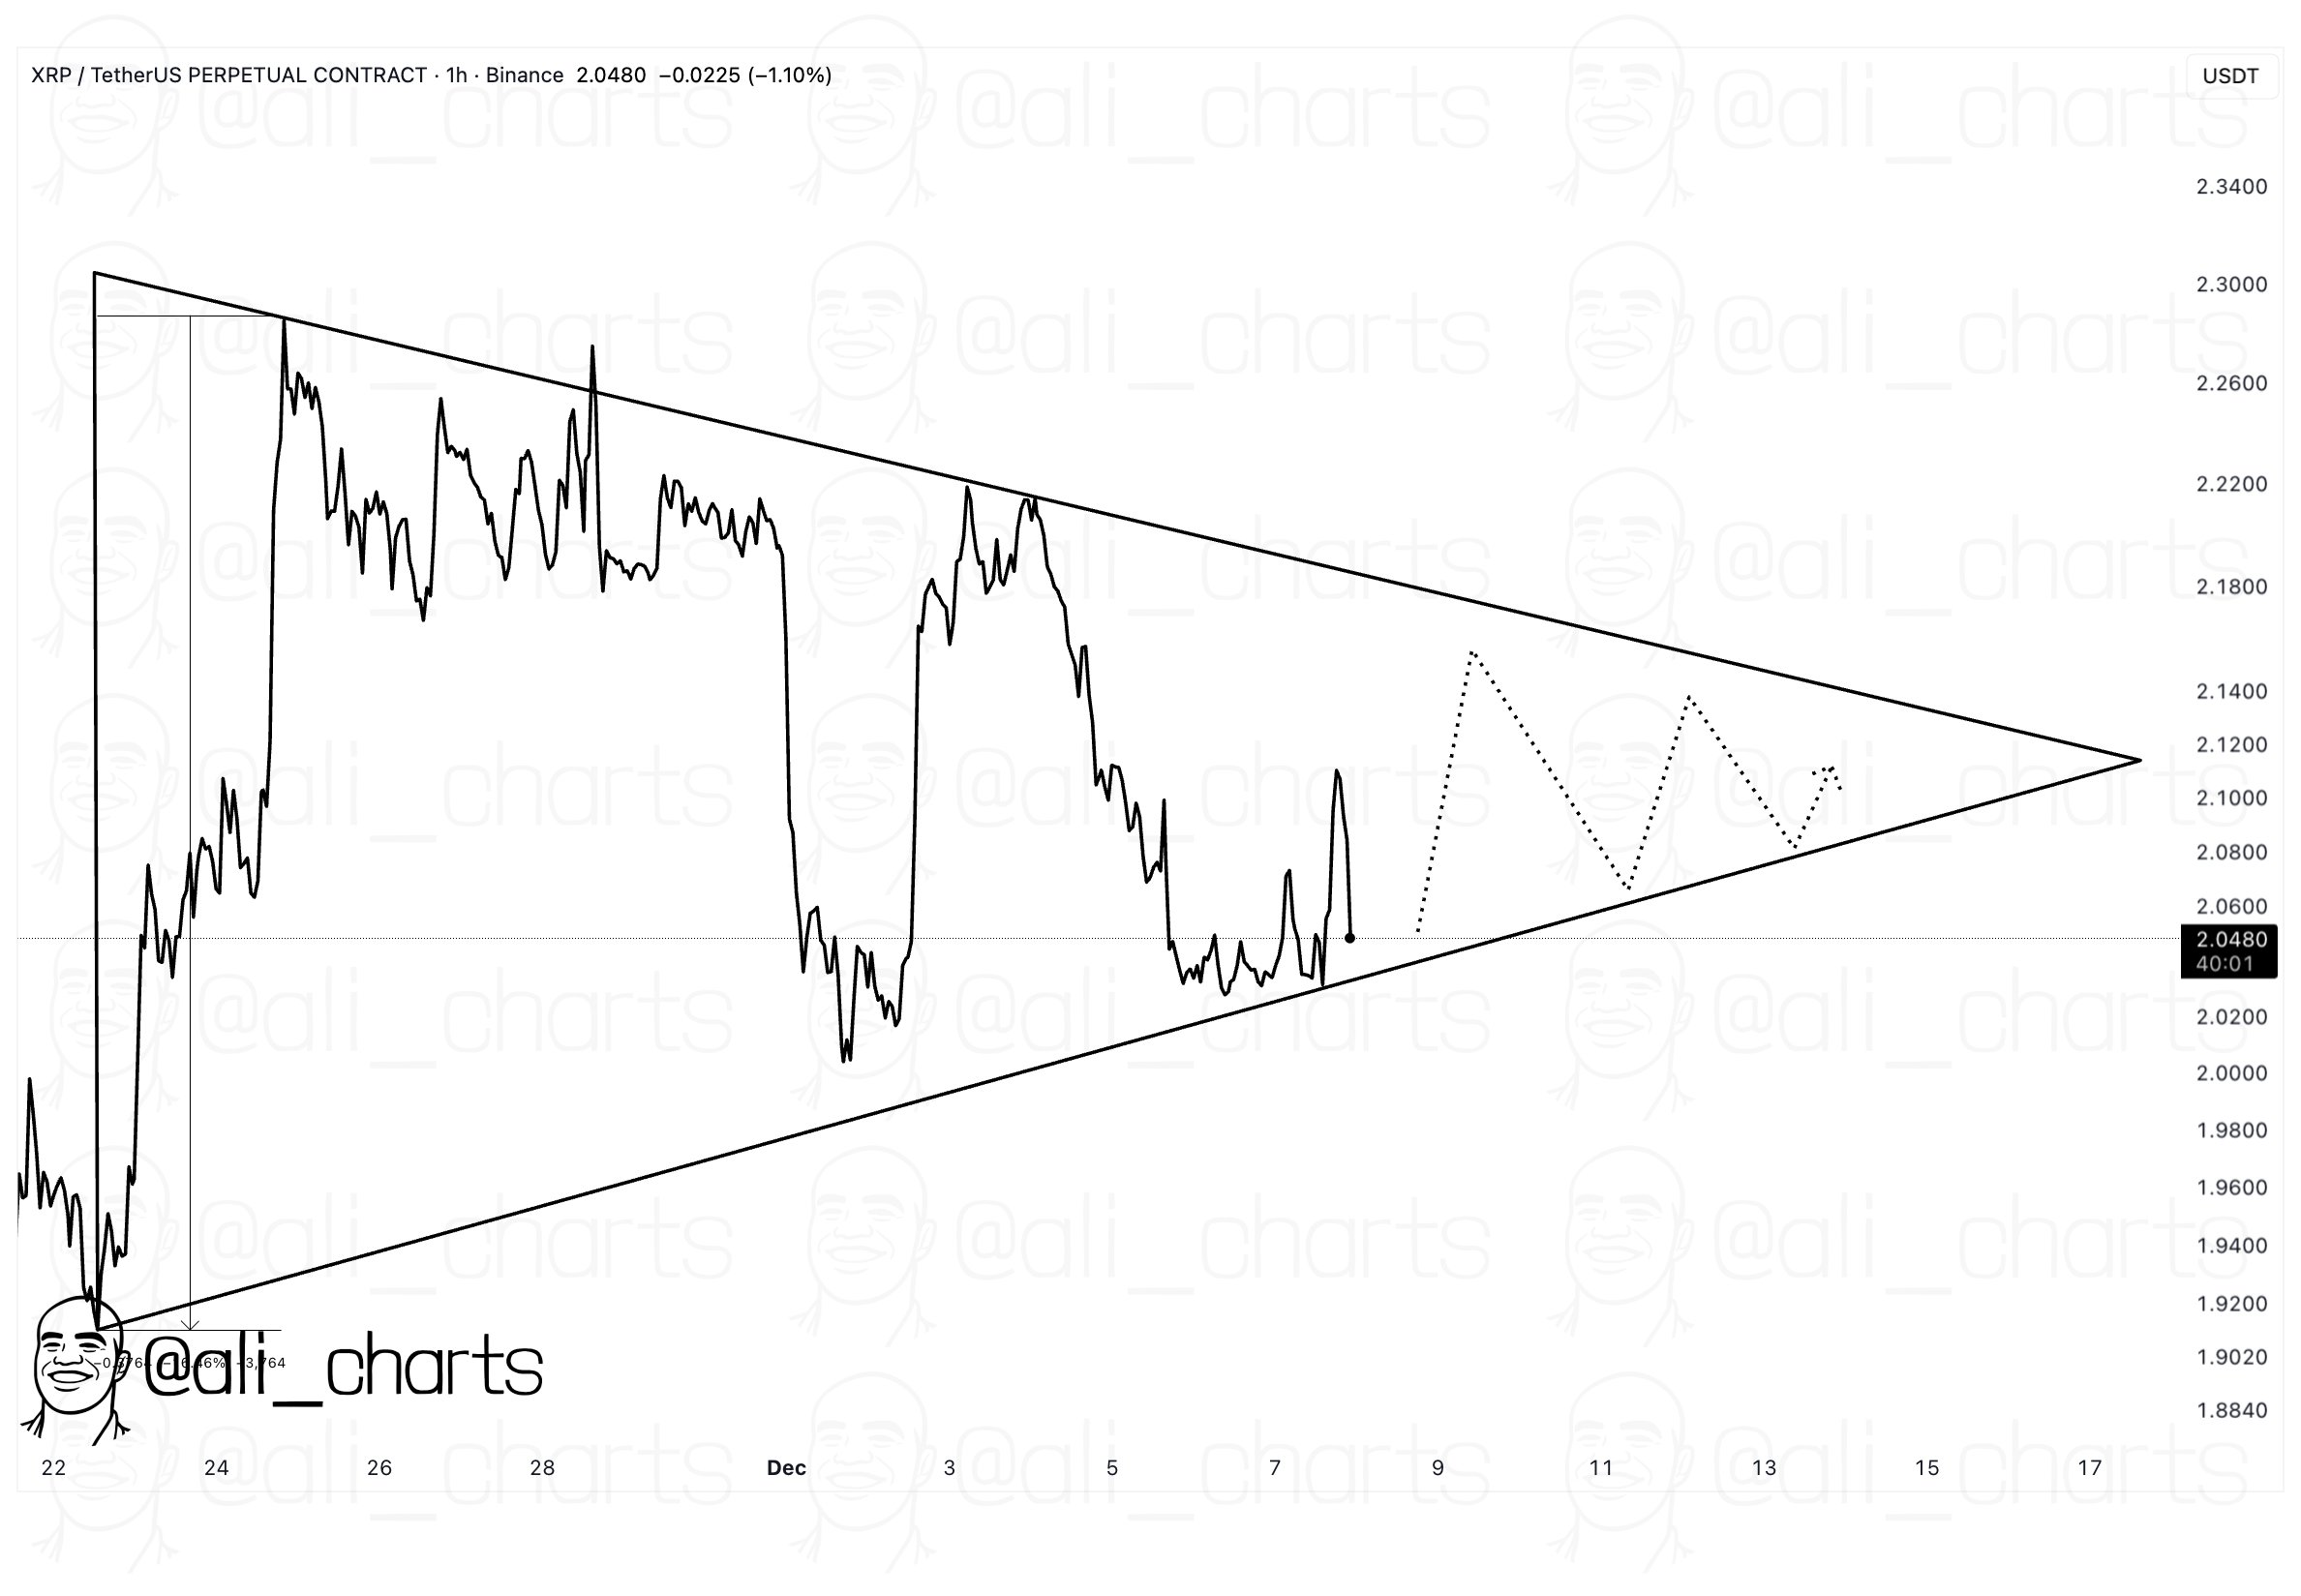
The chart, labeled “XRP / TetherUS Perpetual Contract, 1h, Binance,” plots XRP’s price action from late November into early December.
A falling trendline connects a series of lower highs, while a rising trendline links higher lows.
Together they form a symmetrical triangle that narrows toward mid-December, showing compressing volatility as buyers and sellers converge.
Price now trades near 2.05 dollars, close to the lower boundary of the pattern. Earlier in the formation, XRP swung sharply between roughly 2.30 dollars at the top and just under 1.90 dollars at the base. Each rally stalled sooner than the last, while every dip found support at slightly higher levels, drawing the two lines closer together.
Ali’s projection comes from the usual way technicians measure these structures. The widest part of the triangle spans about 16 percent from top to bottom.
Analysts often apply that distance to the eventual breakout point, either upward or downward, to estimate the size of the next move.
For the bullish case, an hourly close above the descending trendline, currently near the low-2.10 dollar area, would mark a clean break of the upper boundary.
In that scenario, the measured move points toward a zone in the mid-2.30s, where prior supply and psychological resistance could emerge.
On the other hand, a decisive drop below the rising support line, which now sits just above 2.00 dollars, would confirm a downside break.
In that case, the same 16 percent projection would imply room toward the high-1.70s or low-1.80s, near previous demand.
Until one of those levels gives way, XRP remains locked inside the triangle, with each swing growing smaller as the apex approaches.
The setup highlights a period of balance rather than trend, while Ali’s analysis suggests that the next clear move may be stronger than the recent, choppy trading that led into it.
Disclosure:This article does not contain investment advice or recommendations. Every investment and trading move involves risk, and readers should conduct their own research when making a decision.
Kriptoworld.com accepts no liability for any errors in the articles or for any financial loss resulting from incorrect information.

Tatevik Avetisyan is an editor at Kriptoworld who covers emerging crypto trends, blockchain innovation, and altcoin developments. She is passionate about breaking down complex stories for a global audience and making digital finance more accessible.
📅 Published: December 8, 2025 • 🕓 Last updated: December 8, 2025
