


Zebec Network (ZBCNUSD) printed a tight bullish pennant on the daily chart dated Oct 23, 2025.
Price trades near $0.00366, compressing between rising support around $0.0035 and descending resistance near $0.0048–$0.0050.
The setup follows a strong rally from spring, which built the “flagpole.”
A bullish pennant is a brief consolidation that slopes slightly against the prior impulse and ends with a continuation break in the same direction.
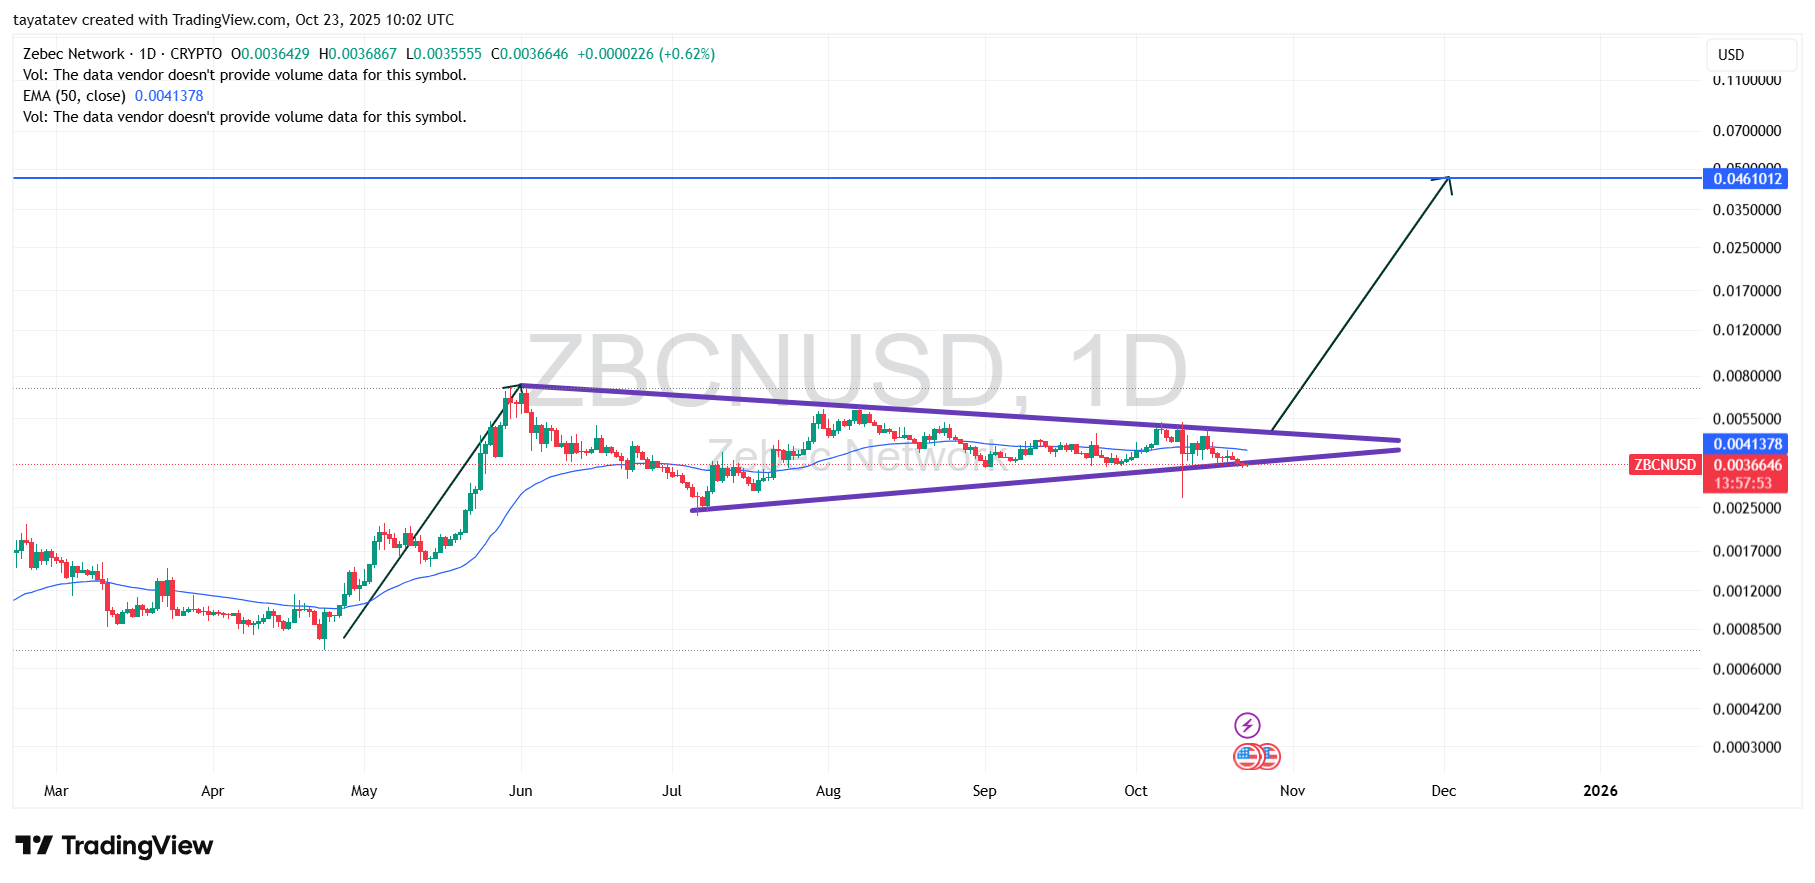
If buyers close decisively above the pennant’s top and reclaim the 50-day EMA around $0.00414, the pattern confirms.
Then the measured move uses the flagpole height to project targets. From today’s price, a validated breakout implies roughly a 1,000% advance, placing a realistic objective near $0.040–$0.046.
The chart already marks ~$0.04610 as a logical magnet, aligning the projection with a visible historical supply shelf.
The case for realism rests on structure and symmetry. First, the consolidation stayed orderly for months, which often stores energy for a single directional release. Second, the pennant formed after a steep impulse, preserving trend context.
Third, the upper boundary sits close enough that a clean daily close above it would flip resistance to support and invite momentum algorithms.
Although the volume pane is unavailable, continuation patterns typically require expansion on the break; traders will look for that confirmation when the candle clears the range.
Until then, price must hold the rising base. A daily close back below the lower rail near $0.0035 would neutralize the setup and risk a deeper mean reversion.
However, as long as the floor holds and price curls above the 50-day EMA, the path of least resistance remains up.
A breakout and hold above ~$0.005 would open the staircase toward prior mid-range waypoints and, in sequence, the projected zone around $0.046, which sits just above an 11x move from current levels.
ZBCN MACD turns negative on Oct 23, 2025; momentum needs a fresh crossover to confirm upside
ZBCN’s daily MACD (12,26,9) shows the MACD line slipping below the signal line in mid-October while the histogram flipped red. That cross confirms fading bullish momentum after the early-October bounce.
The slope of both lines now points down, which usually argues for consolidation or a retest of support until buyers regain control.
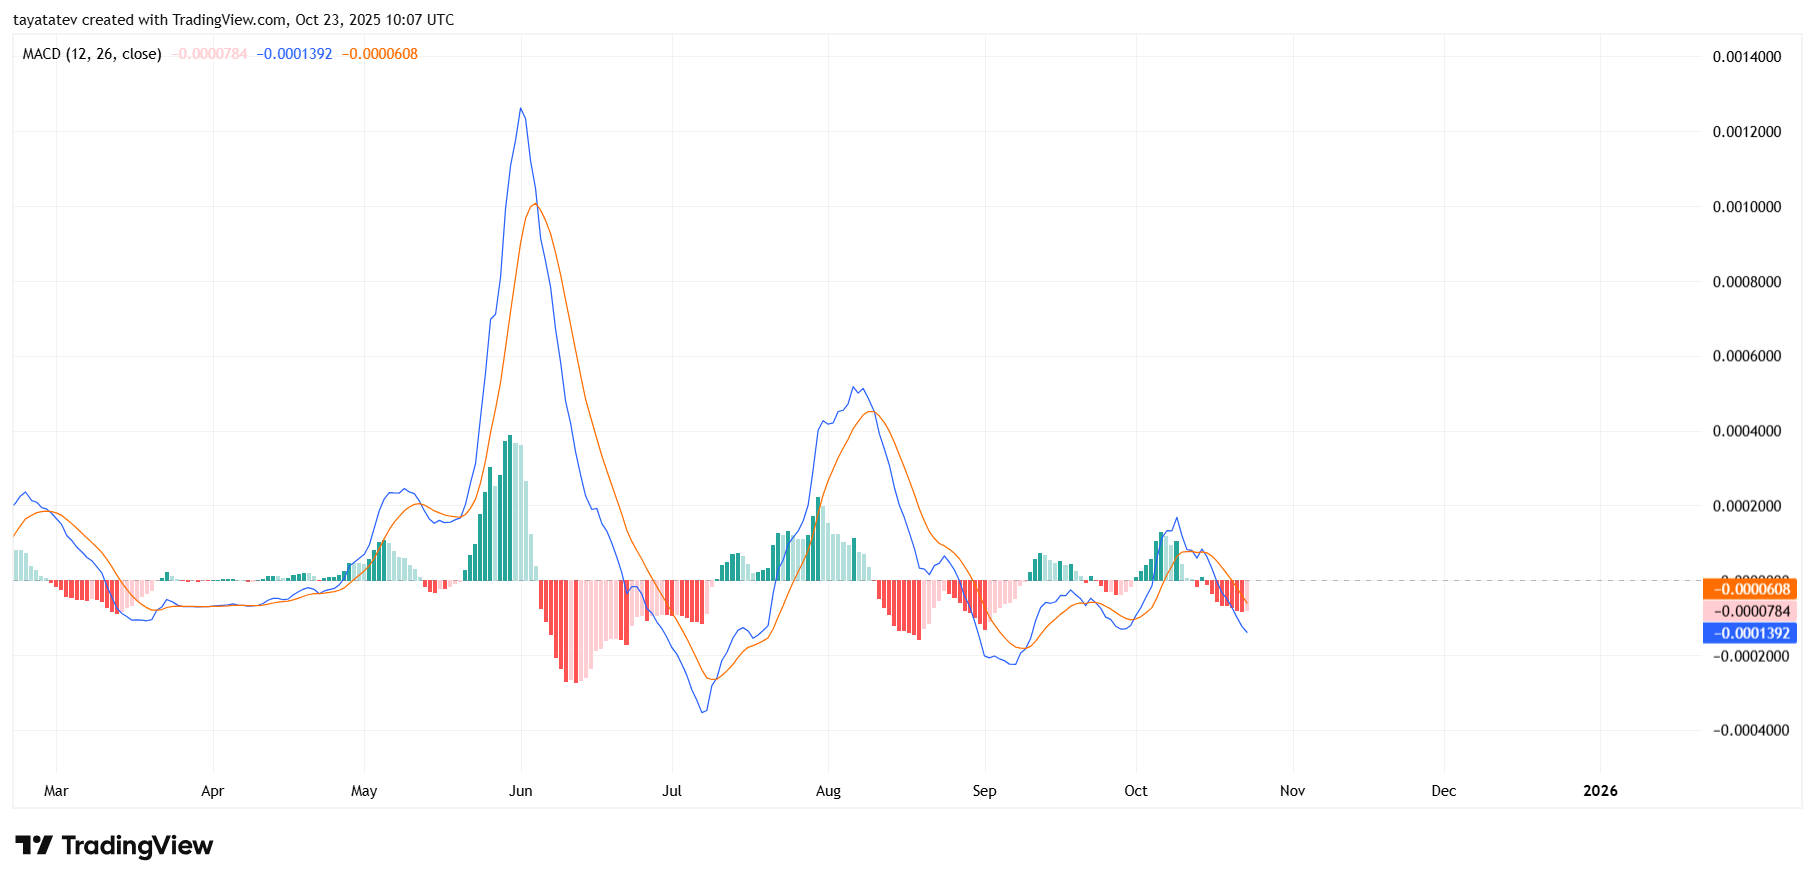
However, the structure remains early in its downswing. If the histogram starts printing shallower red bars and the MACD line hooks higher toward the signal line, a bullish crossover can form above or near the zero line.
That shift often aligns with expansion in trend and would fit the pennant-breakout scenario on price.
Until that turn, the negative spread warns that rallies may stall at nearby resistance.
Context matters across time frames. Over the past six months, prior upside waves began with the MACD curling up from sub-zero and crossing decisively, followed by several sessions of expanding green bars.
A similar sequence would strengthen any breakout above the pennant’s top. Conversely, a deeper move below zero with widening red bars would argue for patience and tighter risk on long setups.
Disclosure:This article does not contain investment advice or recommendations. Every investment and trading move involves risk, and readers should conduct their own research when making a decision.
Kriptoworld.com accepts no liability for any errors in the articles or for any financial loss resulting from incorrect information.

Tatevik Avetisyan is an editor at Kriptoworld who covers emerging crypto trends, blockchain innovation, and altcoin developments. She is passionate about breaking down complex stories for a global audience and making digital finance more accessible.
📅 Published: October 23, 2025 • 🕓 Last updated: October 23, 2025
