

 holds above the 2 year MA. Is the uptrend intact")
Price trades near $0.204 and is knocking on a two-week descending trendline drawn from the early-October swing high.
At the same time, the volume profile shows a thick node around $0.20–$0.21, which often acts like a magnet.
Stay ahead in the crypto world – follow us on X for the latest updates, insights, and trends!🚀
Today’s candle tagged the trendline intraday and pulled back only slightly, showing buyers willing to test that ceiling again.
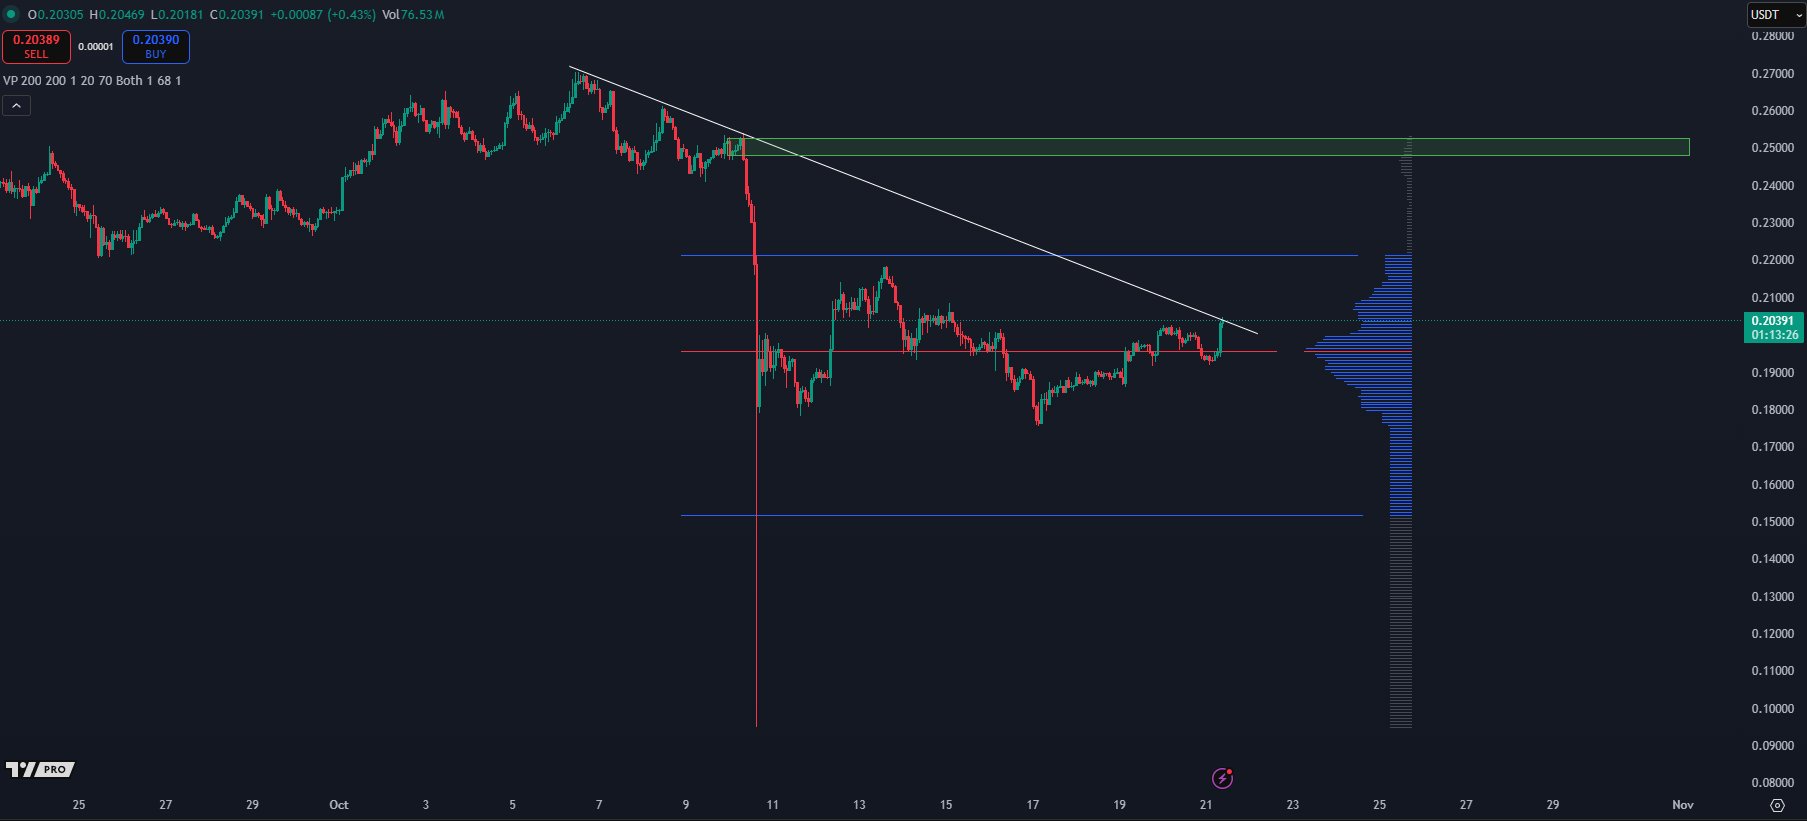
Earlier this month, a sharp sell-off carved the long red wick on the chart and flushed price into the mid-$0.10s.
Since then, the market built a tight range with support around $0.198 (red line) and interim resistance near $0.218 (upper blue line). This is classic repair after a liquidation move: compress first, then choose direction.
If bulls break and hold above the trendline—think acceptance on several candles over $0.206–$0.208—the next objective sits at $0.218.
Clearing that opens a run into the $0.245–$0.25 supply zone (green band), where prior distribution began.
The volume gap between $0.22 and $0.24 could let price travel quickly if momentum appears.
However, if the trendline rejects price again, the market likely rotates back to $0.198.
Losing that base would expose the lower profile troughs near $0.19, with a deeper air-pocket down toward the $0.16 area (lower blue line from the capitulation wick).
Until the ceiling breaks, the path of least resistance remains sideways to soft inside the range.
Bottom line: today’s test puts the market at decision. A clean breakout and acceptance over the trendline favors a push to $0.218 first and then $0.245–$0.25. Failure at the line keeps the range intact and raises the risk of a $0.198 retest.
Oct 21, 2025 — DOGE holds above the 2-year moving average
Dogecoin remains above the rising 2-year moving average (2Y MA). Price has respected this baseline since mid-2023, turning it into a trend filter.
As long as weekly closes stay above it, the market signals an intact primary uptrend.
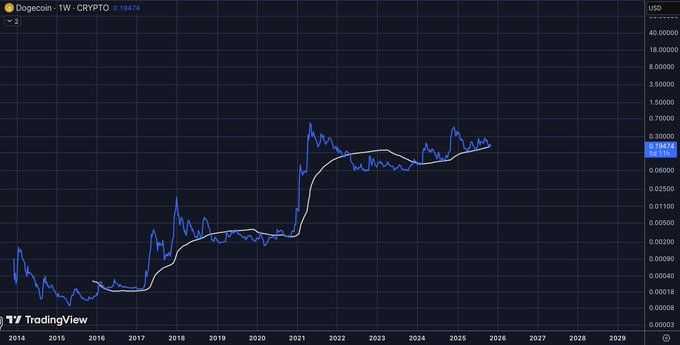
After the 2021 spike and a long lateral range, DOGE compressed into higher lows through 2024–2025.
Meanwhile, the 2Y MA climbed underneath price and flattened drawdowns, which shows improving longer-term momentum. Each tap of the average triggered demand and quick recoveries, indicating buyers defend this line.
Looking ahead, if DOGE continues to close above the 2Y MA, the path favors rotation back to the $0.24–$0.30 band where supply capped advances earlier in 2025.
A strong weekly close through that shelf would put the $0.35+ area in play from prior distribution.
Conversely, a clean weekly break and acceptance below the 2Y MA would flip the signal to caution and invite tests of the spring base in the $0.15–$0.17 zone.
Disclosure:This article does not contain investment advice or recommendations. Every investment and trading move involves risk, and readers should conduct their own research when making a decision.
Kriptoworld.com accepts no liability for any errors in the articles or for any financial loss resulting from incorrect information.

Tatevik Avetisyan is an editor at Kriptoworld who covers emerging crypto trends, blockchain innovation, and altcoin developments. She is passionate about breaking down complex stories for a global audience and making digital finance more accessible.
📅 Published: October 22, 2025 • 🕓 Last updated: October 22, 2025
