


Zcash’s ZECUSDT 1h chart on Oct 30, 2025 shows price trading inside a rising wedge that formed after the Oct 27 spike.
Buyers kept making higher lows, but the ceiling stayed almost flat near 370–375 USDT. A rising wedge is a pattern where price climbs in a narrowing structure, and pressure builds toward the upper line.
When volume supports the move and the breakout happens to the upside, the market often extends the previous impulse.
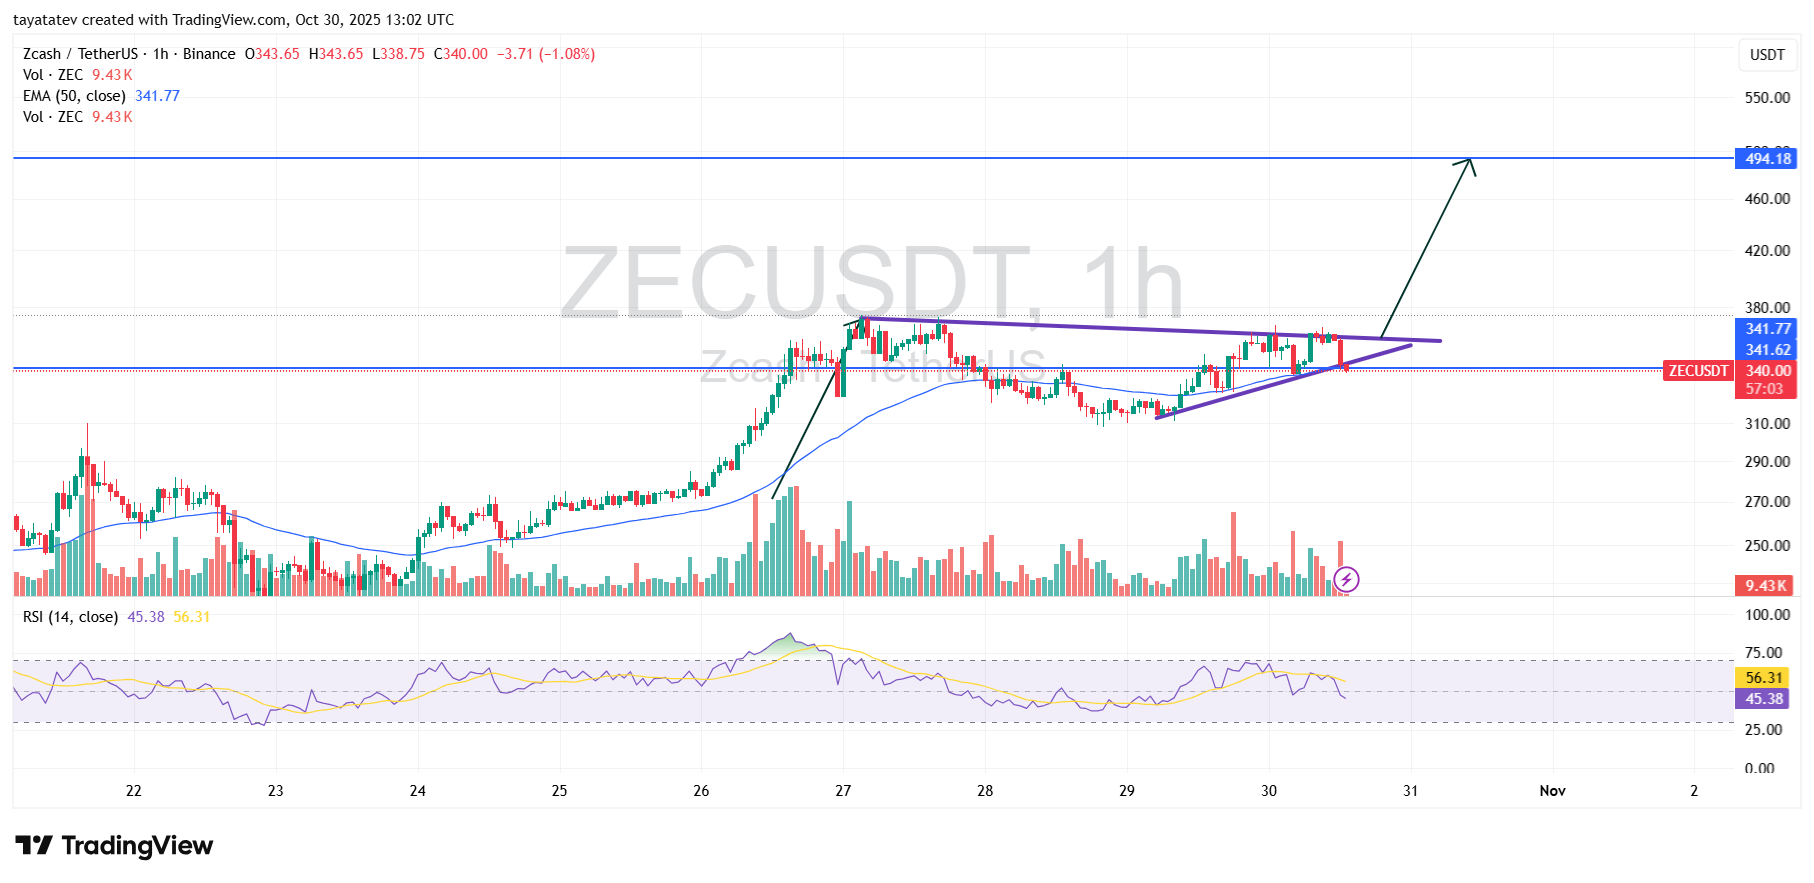
Right now ZEC sits on support. The red candle marked tapped the wedge’s lower trendline and the horizontal line near 338–341 USDT, which also matches the 50 EMA around 341.77 USDT.
That is a confluence zone. As long as candles hold above that band, sellers do not control the chart.
In this setup, price should not fall much below this area. A clean break under the wedge and the EMA would invalidate the bullish scenario.
The bullish view stays active while ZEC holds above 338–341 USDT and pushes back into the upper purple line.
If the wedge breaks upward with a 1h close above the recent intraday highs around 372–378 USDT and volume expands, the measured move points to the blue line on chart.
A 45 percent extension from the current zone near 340 USDT targets about 494 USDT, which is exactly where placed the horizontal resistance (340 × 1.45 ≈ 493 → chart shows 494.18). That level is the upside objective.
Volume supports this reading. During the Oct 26–27 rally, green bars expanded, then volume cooled while price compressed inside the wedge.
That is classic continuation behavior: strong leg, pause, then possible second leg. RSI is still above 50 (about 56), so momentum stays on the bullish side, not in breakdown territory.
So the structure is: rising wedge after an impulsive leg, support at 338–341 USDT, resistance and breakout trigger at 372–378 USDT, target near 494 USDT if confirmed.
If candles stay above support, bulls keep control. If the wedge fails and price closes below support, the pattern is off.
ZEC 1h MACD Shows Momentum Cooling After Oct 27 Spike
ZEC’s 1h MACD shows the rally on Oct 27 very clearly: the MACD line (blue) shot above the signal line (orange), histogram turned deep green, and momentum peaked near the same time the price hit the intraday top.
After that, the MACD rolled over fast, crossed below the signal, and printed a long red sequence on Oct 28. That was the correction phase you saw on the price chart.
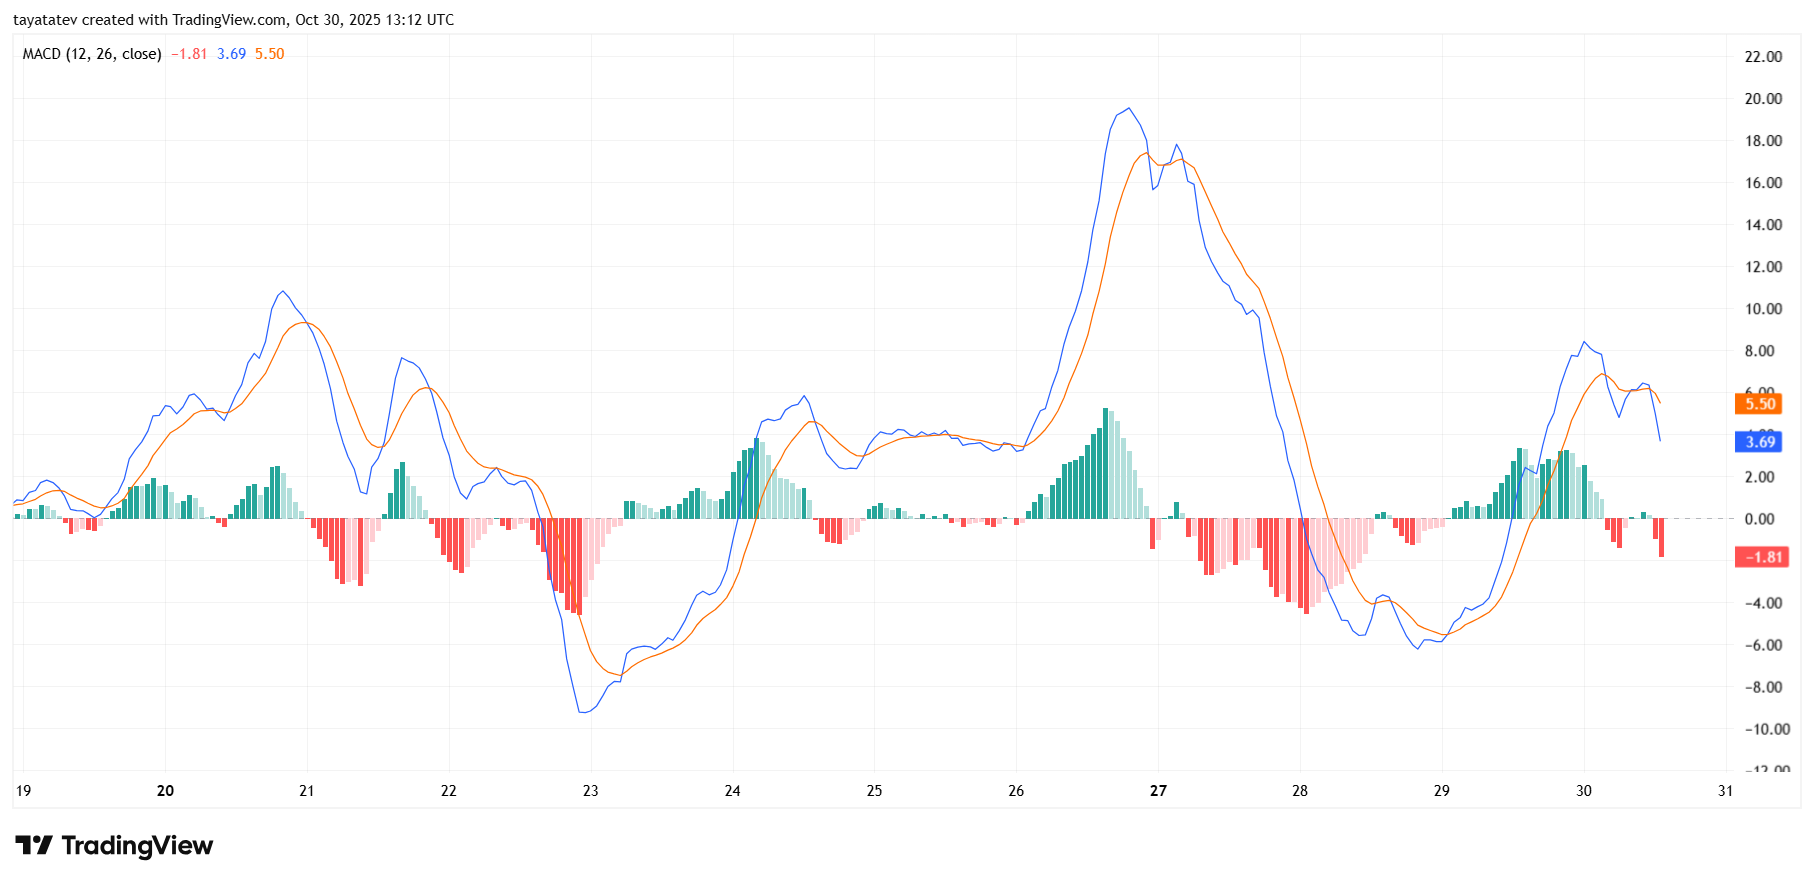
From late Oct 29 into Oct 30 the indicator tried to recover. MACD line climbed back above the signal, histogram turned green again, but this second wave was weaker than the Oct 27 impulse.
Now, at the right edge, MACD is bending down again while the histogram flips back to red. That tells us momentum is cooling while price is still sitting on support.
This fits the wedge setup on the price chart: price is compressing, but momentum is not yet trending up.
For a clean bullish confirmation, MACD must turn back up above the signal and the histogram must go green again at the same time price breaks the upper wedge line.
If MACD keeps drifting down from here, it will only mean the breakout is delayed, not cancelled, as long as price holds the 338–341 USDT support.
Disclosure:This article does not contain investment advice or recommendations. Every investment and trading move involves risk, and readers should conduct their own research when making a decision.
Kriptoworld.com accepts no liability for any errors in the articles or for any financial loss resulting from incorrect information.

Tatevik Avetisyan is an editor at Kriptoworld who covers emerging crypto trends, blockchain innovation, and altcoin developments. She is passionate about breaking down complex stories for a global audience and making digital finance more accessible.
📅 Published: October 30, 2025 • 🕓 Last updated: October 30, 2025
