

 Charts Hint at 45% Jump, 200% Still on Table")
Shiba Inu’s daily chart on November 13, 2025 shows a clear falling wedge pattern, a structure where price moves lower inside two converging trendlines and often signals a potential bullish reversal.
If the pattern confirms with a breakout above the upper boundary, SHIB could climb about 45 percent from the current level near 0.00000980 toward the 0.00001427 area.
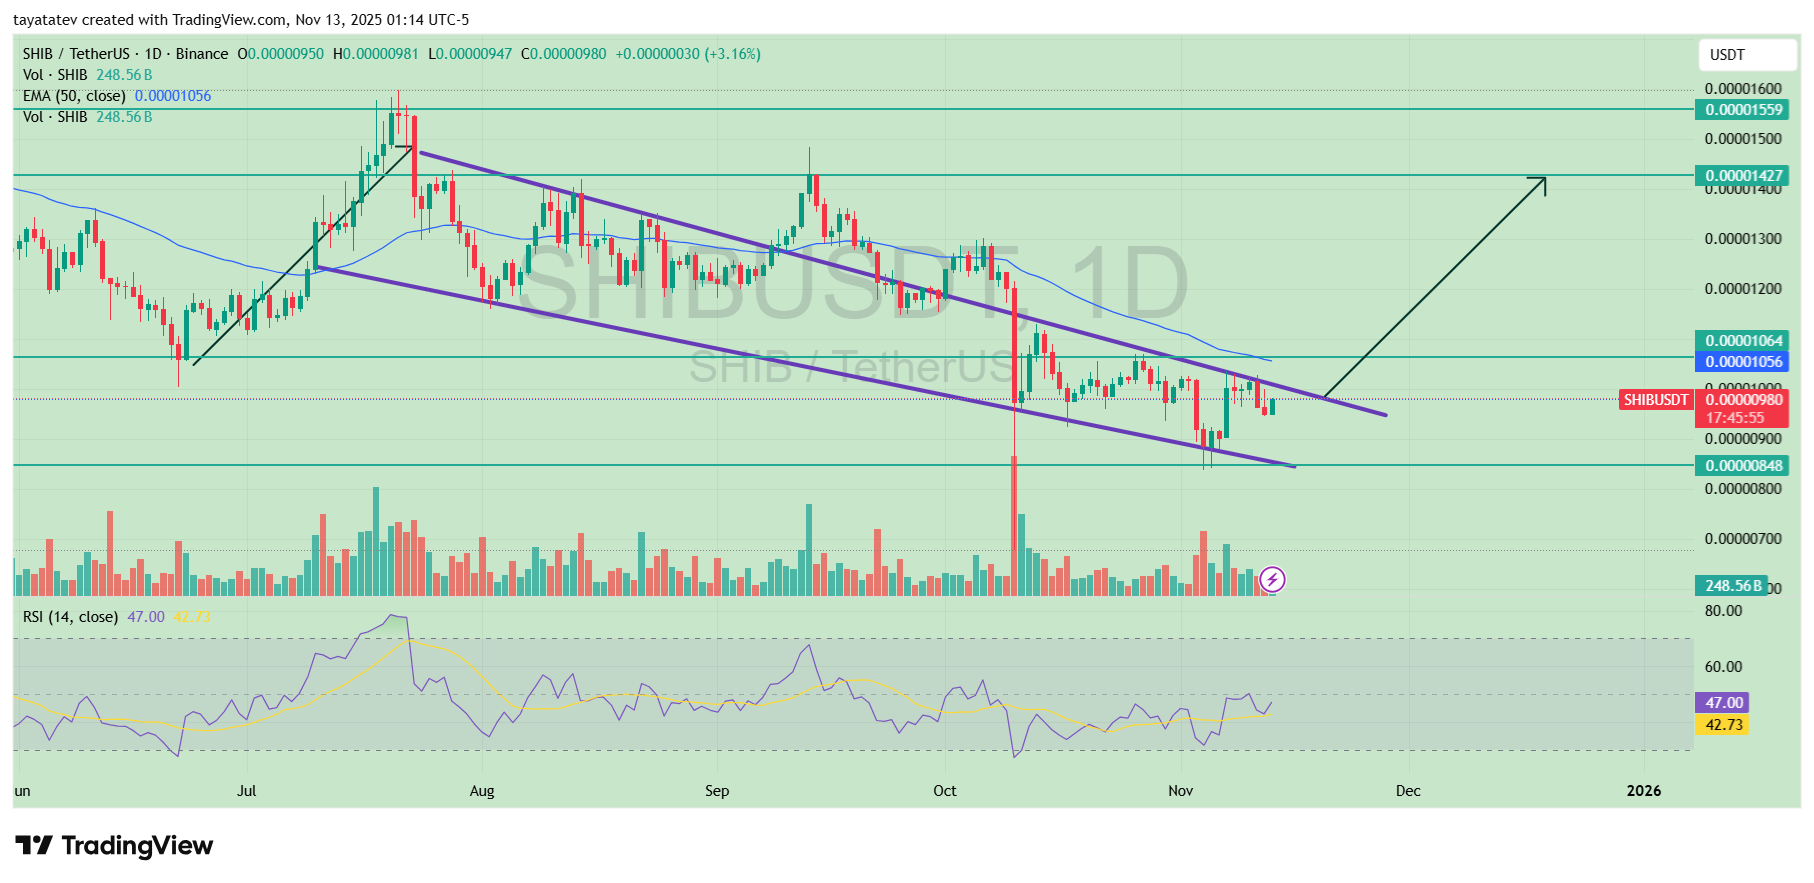
Price trades just under the wedge’s upper trendline, while the 50-day exponential moving average sits around 0.00001056 and acts as the first resistance. A close above both levels would show a shift in momentum.
The next resistance zone stands near 0.00001164, followed by the larger target around 0.00001427, which aligns with a mid-August supply band.
Support remains firm at 0.00000900 and again at 0.00000848, where previous reactions formed a base during October.
These areas define the lower portion of the wedge and show where buyers previously stepped in.
Volume stays moderate and has not expanded yet, which means confirmation will rely on a breakout accompanied by stronger activity.
The relative strength index sits near 47 and turns upward with a rising short-term signal line, indicating improving momentum but not yet overbought conditions.
If RSI crosses above 50 while price breaks the wedge, it would strengthen the bullish case.
For now, SHIB holds inside the pattern and approaches its upper boundary. A decisive move above the trendline and the 50-day EMA would validate the wedge and open the path toward the projected 45 percent target.
Analyst sees SHIB eyeing 200% move after accumulation breakout
Crypto analyst Javon Marks says Shiba Inu has already broken out of a key accumulation zone on the higher-timeframe chart.
He points to an earlier bullish divergence, where price made lower lows while momentum indicators turned higher, as a sign that selling pressure has been fading through 2025.
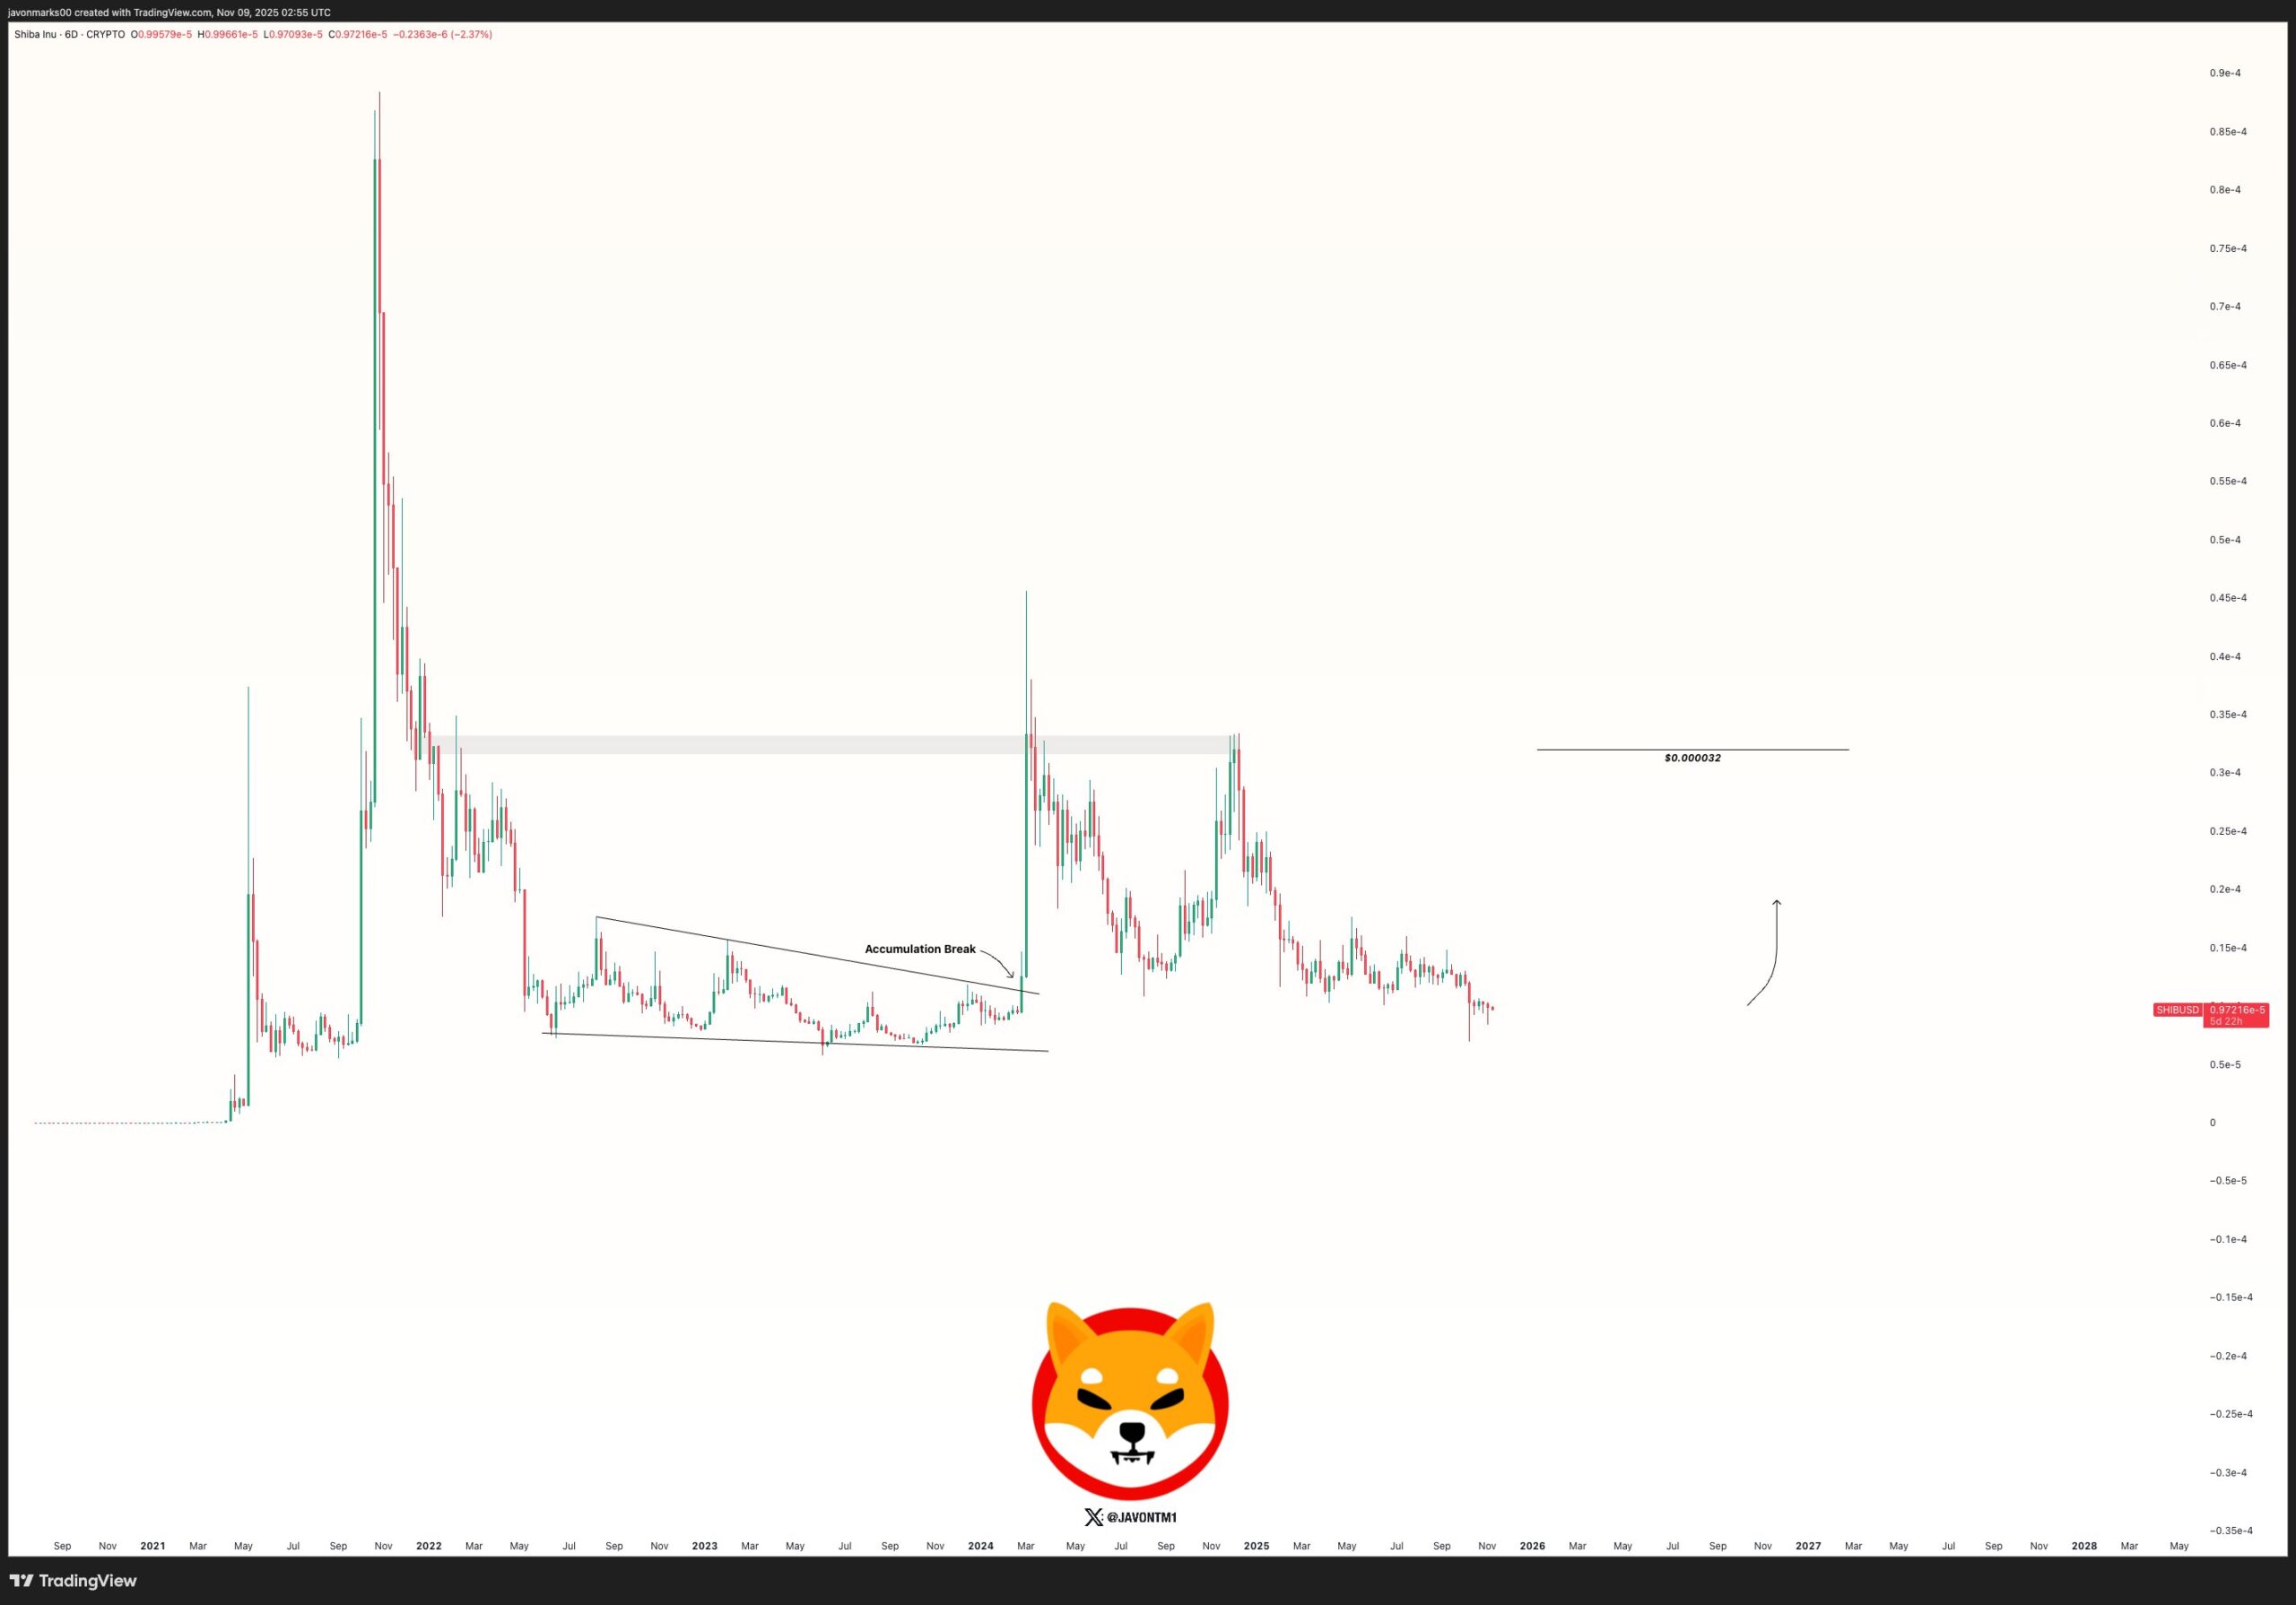
According to his chart, the breakout leaves room for SHIB to extend higher toward a major resistance band in the $0.000032 area.
From current levels, that move would represent roughly a 200 percent gain if buyers keep control.
Marks’ map shows historical supply clustering near that zone, suggesting it remains the next significant level traders will watch if the rally unfolds.
Disclosure:This article does not contain investment advice or recommendations. Every investment and trading move involves risk, and readers should conduct their own research when making a decision.
Kriptoworld.com accepts no liability for any errors in the articles or for any financial loss resulting from incorrect information.

Tatevik Avetisyan is an editor at Kriptoworld who covers emerging crypto trends, blockchain innovation, and altcoin developments. She is passionate about breaking down complex stories for a global audience and making digital finance more accessible.
📅 Published: November 13, 2025 • 🕓 Last updated: November 13, 2025
