

 Charts Now Signal One Big Test for the Next Major Trend")
Dogecoin now shows a rare alignment across yearly, multi-day, and intraday charts, with price tightly coiling inside long-term ranges while pressing against short-term downtrend lines.
This stack of consolidation and key supports sets up a decisive move next, with the direction likely defined by how DOGE reacts to its current trendline and channel boundaries.
Stay ahead in the crypto world – follow us on X for the latest updates, insights, and trends!🚀
Dogecoin Yearly Chart Signals Tight Consolidation
Dogecoin’s yearly chart now shows four inside candles, and the pattern points to a prolonged consolidation phase.
The chart from Cantonese Cat indicates each yearly candle has stayed within the range of the large 2021 bar, forming a clear compression zone.

At the same time, the price continues to move between the same upper and lower boundaries highlighted on the chart.
The structure limits volatility while keeping the broader range intact. The repeated inside-year candles show how the market has paused after the major expansion three years ago.
Moreover, the technical setup aligns with a continuation pattern. The primary trend on the long-term chart remains up, and compressed yearly ranges often resolve in the direction of the dominant trend.
When a breakout finally happens, historical behavior suggests it usually follows the long-term trajectory rather than reversing it.
This yearly structure, combined with the defined range, gives a clear view of how DOGE is coiling after the earlier rally.
Dogecoin Tests Long-Term Channel Support As 2-Year MA Flips To Resistance
Meanwhile, Dogecoin’s 3-day chart sits inside a broad rising channel that has guided price since the 2021 peak near 0.75 dollars.
The lower boundary has caught three major lows so far, around 0.04, 0.055, and 0.09 dollars, while the middle line near 0.26 dollars and the upper line around 1.30 dollars mark the main resistance zones.
Each bounce from the bottom line has produced a higher low, so the structure still shows a long-term upward bias despite the recent pullback.
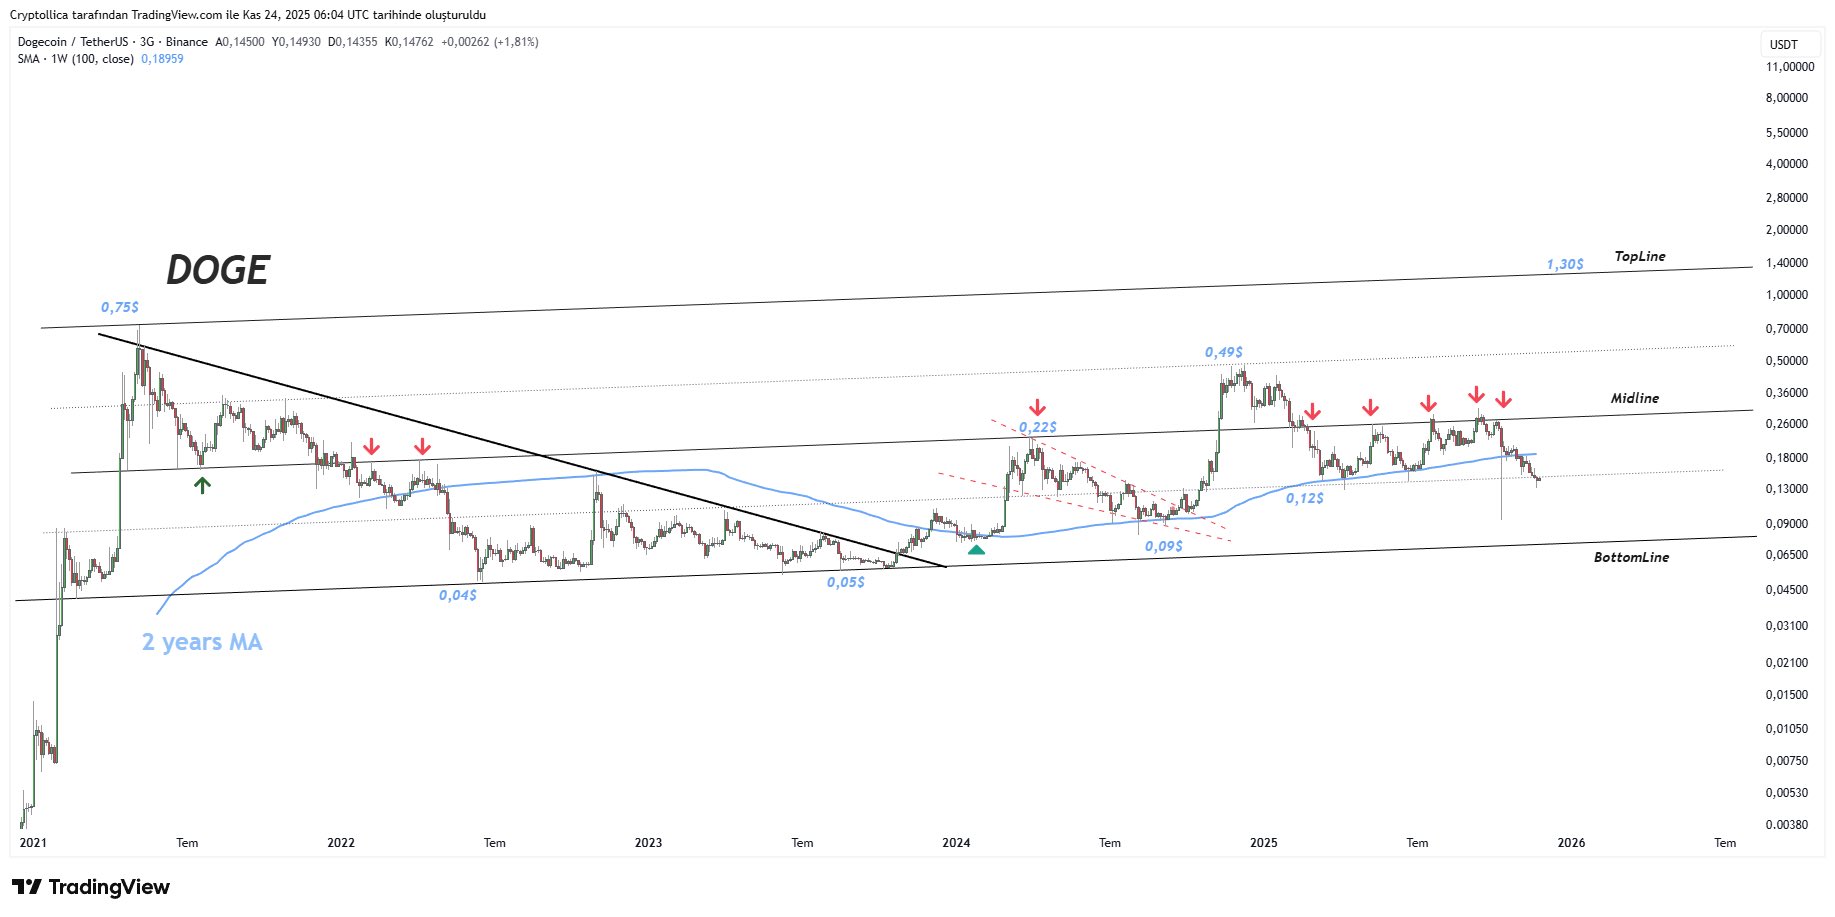
At the same time, DOGE now trades below the two-year moving average, which runs slightly above the current price and has started to act as resistance.
Earlier in the range, this moving average supported the advance, especially during the climb from about 0.055 to 0.22 and then to the 0.49 spike.
The current rejection from the midline, highlighted by several red arrows on the chart, shows how that central band has repeatedly capped rallies across 2023 and 2025.
If the channel keeps holding, the key technical area to watch is the space between the two-year moving average overhead and the rising bottom line underneath.
A clear move back above the moving average and the midline would put prior reaction zones around 0.22 and 0.49 dollars back on the map, while a clean break below the bottom trend line would mark the first major violation of this long-term structure since it formed.
Dogecoin Tests Downtrend Line as Price Pressures Build
Dogecoin’s 4-hour chart, dated November 24, shows the market still trading inside a clear downtrend that has been in place since early November.
The descending blue trendline and the 50-EMA continue to slope downward, confirming the broader bearish structure.
However, the latest candles already show price starting to challenge that structure after refusing to make new lows.
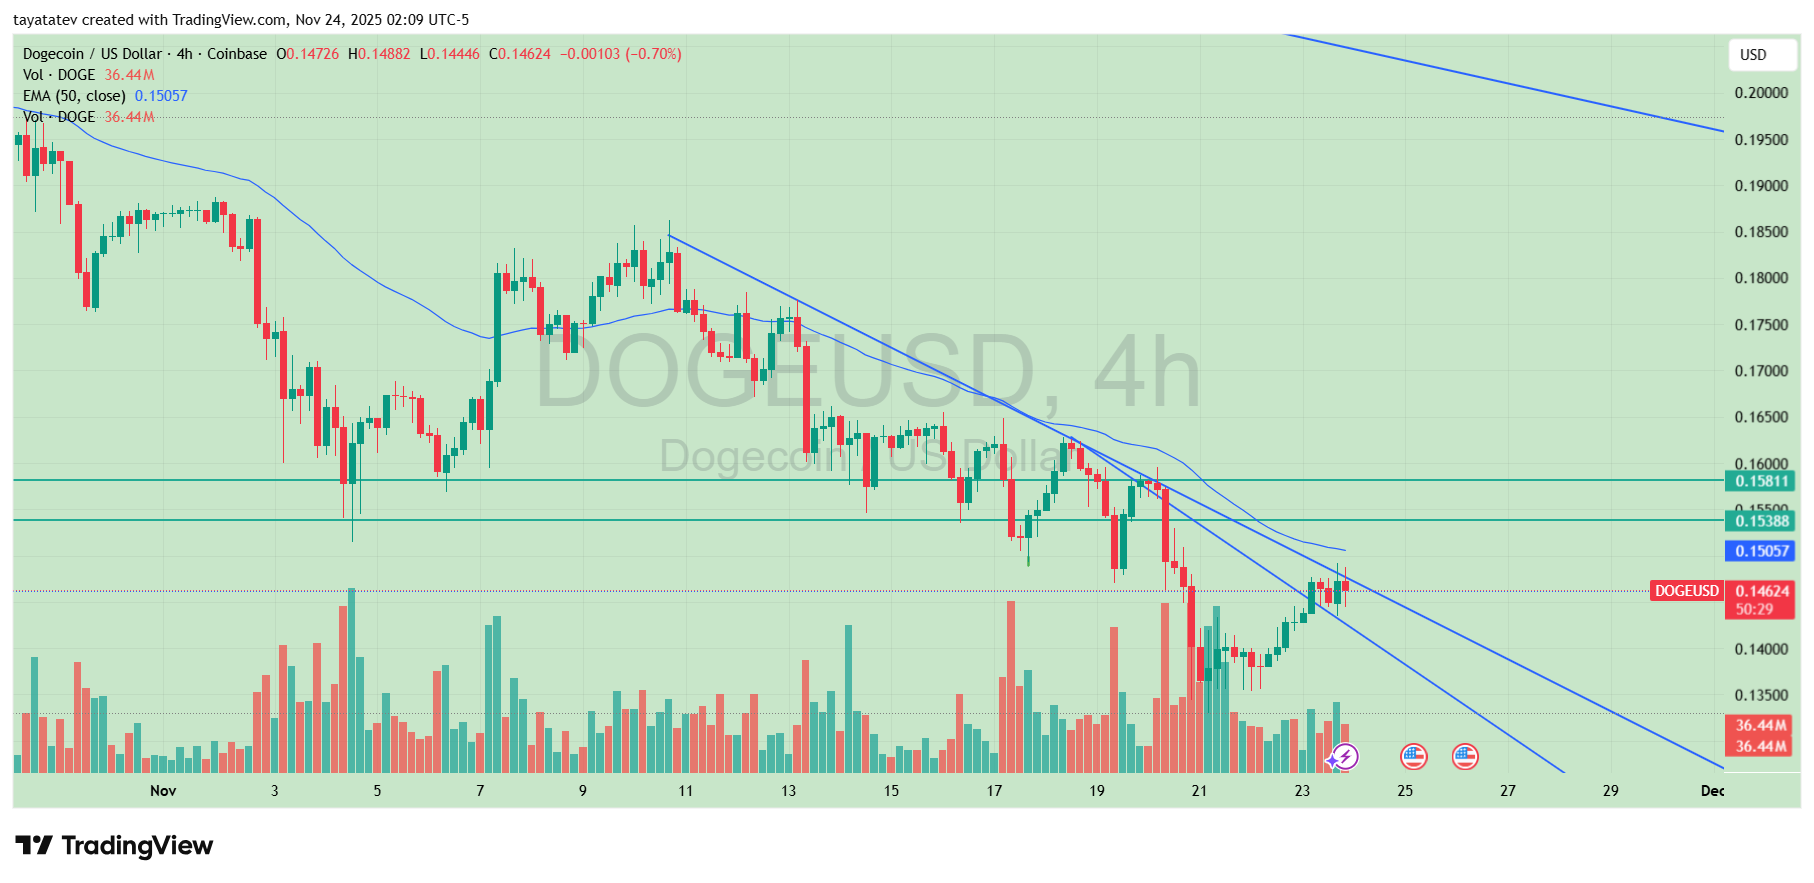
At the same time, DOGE has moved above the local support cluster near 0.1505 dollars.
The market has printed higher lows over the past sessions, signaling that sellers are losing control of the short-term direction. This shift appears as the first sign that the trend is no longer being respected with the same strength as earlier in the month.
Moreover, the key trigger remains the descending blue trendline. If DOGE breaks above this line with stable volume, the price would open the path toward the first green resistance level around 0.1538 dollars.
A clean move through that zone would then expose the second green barrier at 0.1581 dollars.
Breaking both would allow the structure to flip from downtrend to early uptrend, with the market finally reclaiming momentum.
Until that breakout happens, the trend remains down, and overhead pressure stays intact.
A failure at the trendline could send the price back toward the recent lows, keeping the broader bearish channel active.
Disclosure:This article does not contain investment advice or recommendations. Every investment and trading move involves risk, and readers should conduct their own research when making a decision.
Kriptoworld.com accepts no liability for any errors in the articles or for any financial loss resulting from incorrect information.

Tatevik Avetisyan is an editor at Kriptoworld who covers emerging crypto trends, blockchain innovation, and altcoin developments. She is passionate about breaking down complex stories for a global audience and making digital finance more accessible.
📅 Published: November 24, 2025 • 🕓 Last updated: November 24, 2025
