


Dogecoin trades inside a clear downward channel on the daily chart dated Dec. 3, 2025. Price stays below the two descending blue trendlines that have guided every lower high since September.
This structure shows that sellers still control the broader direction, even though the latest rebound attempts to challenge that pattern.
Stay ahead in the crypto world – follow us on X for the latest updates, insights, and trends!🚀
Trading volume remains steady, and the RSI moves slightly higher from oversold levels, which signals early strength but not a confirmed shift.
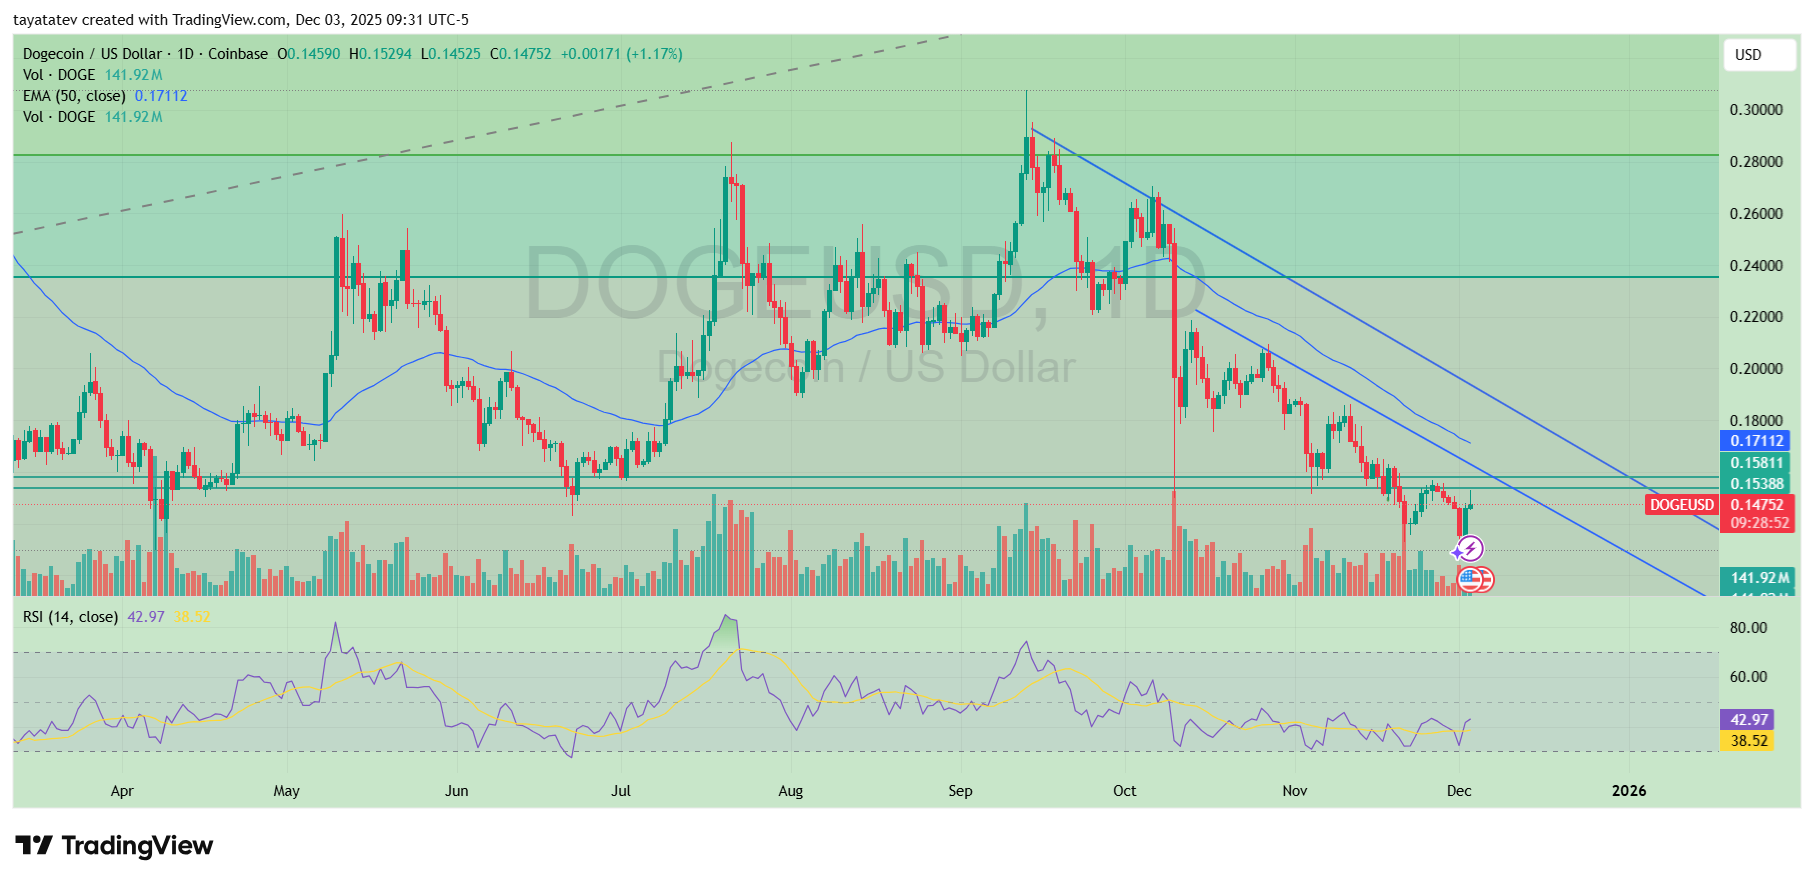
Price now sits just under the important resistance area around 0.158 dollars. This level aligns with the mid-range horizontal band that acted as support several times during the summer.
Because previous bounces failed at the same zone, Dogecoin needs a clean daily close above 0.158 dollars to confirm a trend reversal. Until that happens, the move stays inside the falling structure and carries limited follow-through.
The 50-day exponential moving average around 0.171 dollars adds another barrier above the 0.158 level.
If price breaks both resistance layers, the chart would show the first higher high since September, and momentum would shift toward a short-term recovery.
However, as long as price holds below 0.158 dollars, the market treats every bounce as part of the broader downtrend.
Therefore, Dogecoin must reclaim that zone to confirm that sellers have lost control and that a new upward phase has started.
Dogecoin Sits Below Its Golden Zone on the Weekly Fibonacci Chart
Dogecoin’s weekly Fibonacci levels show a clear structure, and the golden zone stands between the 0.618 level at 0.23524 dollars and the 0.5 level at 0.28239 dollars.
This band usually acts as the decision area for long-term trend strength.
As the chart stretches from the 2024 breakout to the 2025 high near 0.48221 dollars, the retracement pulls price sharply back toward the lower regions of the Fibonacci map.
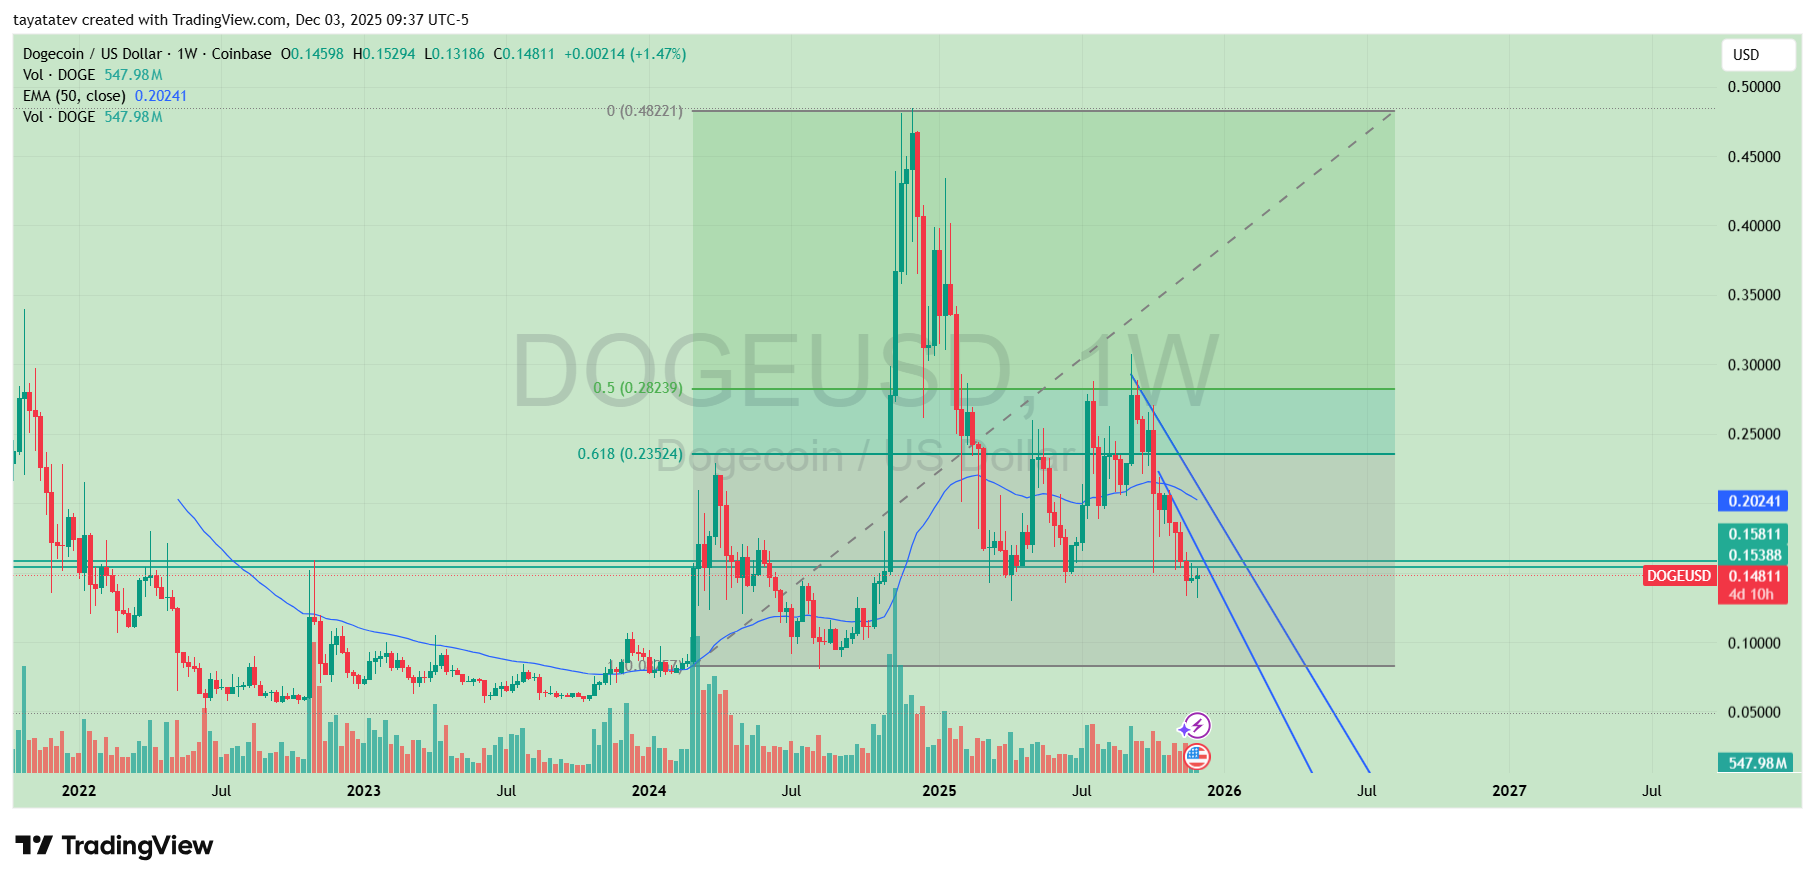
Price now trades well under the golden zone, and this position signals a completed move through the major retracement region.
Because the golden zone often hosts strong reactions, Dogecoin needs to move back toward the 0.235–0.282 dollar range to reclaim momentum.
Until that upward move appears, the market reads the drop as a full retracement rather than a controlled pullback.
The Fibonacci structure therefore highlights the same point: Dogecoin must rise toward the golden zone to rebuild strength.
As long as price remains below that band, the chart reflects weakness rather than support, and the next trend shift depends on whether buyers can push the weekly candles back into that key range.
Disclosure:This article does not contain investment advice or recommendations. Every investment and trading move involves risk, and readers should conduct their own research when making a decision.
Kriptoworld.com accepts no liability for any errors in the articles or for any financial loss resulting from incorrect information.

Tatevik Avetisyan is an editor at Kriptoworld who covers emerging crypto trends, blockchain innovation, and altcoin developments. She is passionate about breaking down complex stories for a global audience and making digital finance more accessible.
📅 Published: December 3, 2025 • 🕓 Last updated: December 3, 2025
