


Dogecoin continues to slide on the weekly chart, moving closer to the Fibonacci golden zone that marked the base of its last major rally.
The chart shows DOGE trading near 0.14 dollars as sellers keep control while momentum stays weak.
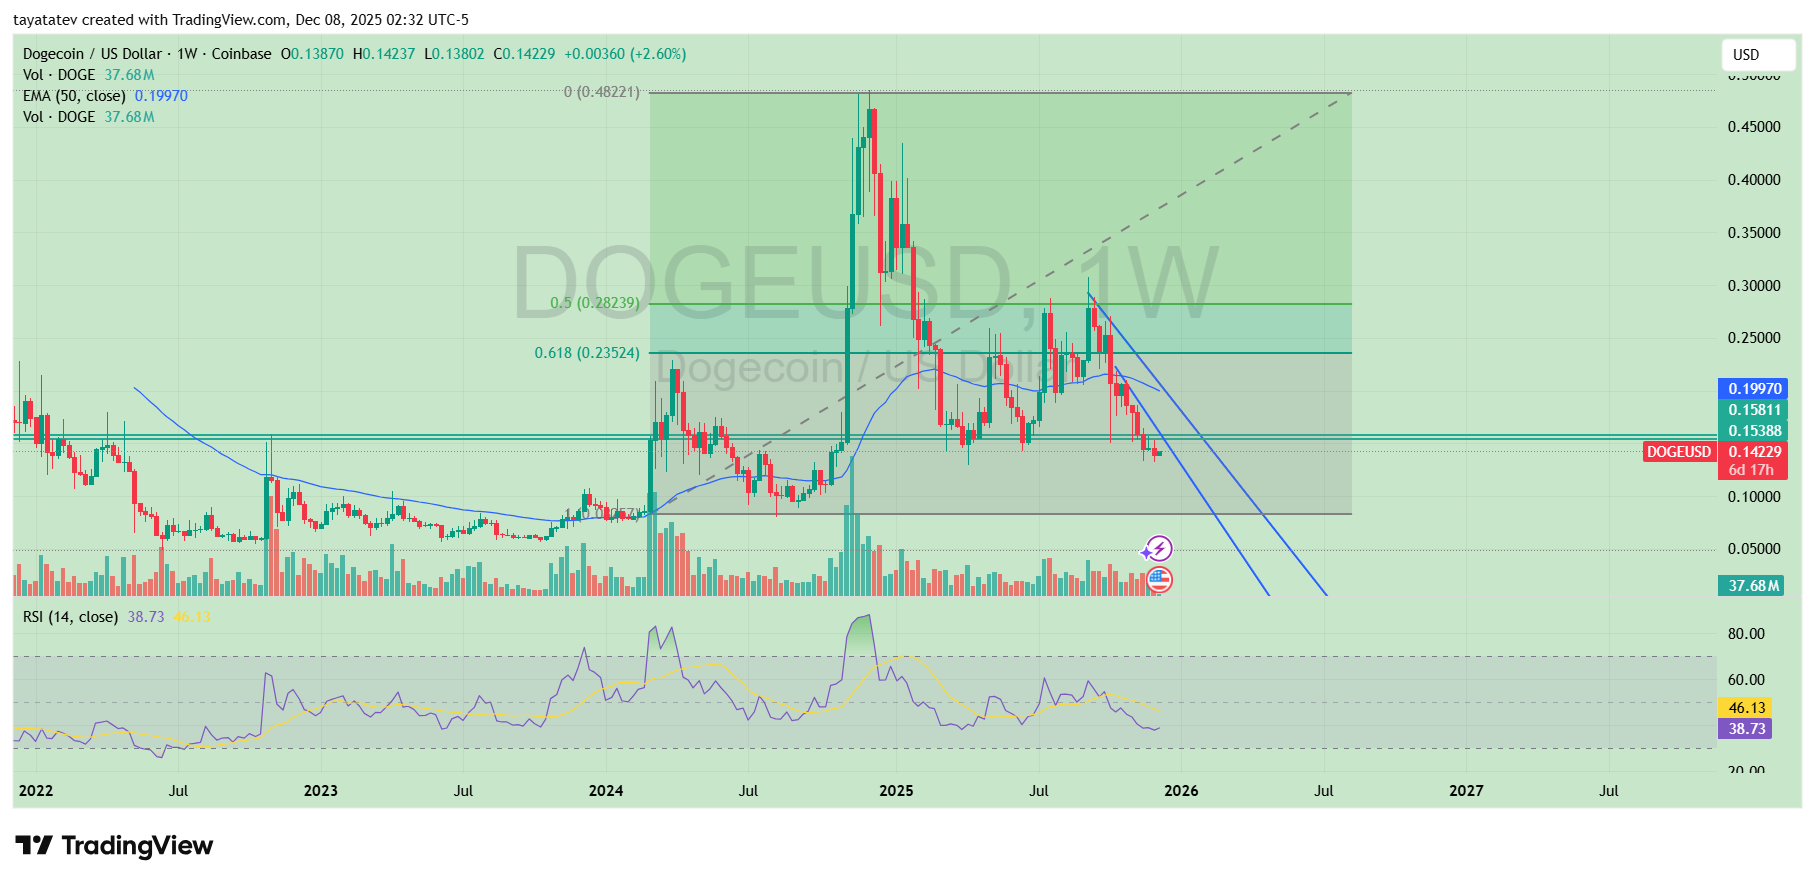
The Fibonacci retracement drawn from the 2023–2025 advance places the golden zone between the 0.618 and 0.5 levels, roughly 0.235 to 0.282 dollars. Earlier this year, DOGE failed to hold above that band and broke lower.
Once price slipped beneath the zone, weekly candles turned into a series of lower highs and lower lows, forming the descending channel highlighted on the chart. That shift confirmed that buyers had lost the trend advantage.
Price now trades well below the 50-week exponential moving average, which sits near 0.20 dollars.
Stay ahead in the crypto world – follow us on X for the latest updates, insights, and trends!🚀
The EMA has consistently acted as dynamic resistance since midyear. Each time DOGE attempted to recover toward the moving average, sellers stepped in before any weekly close above it.
As a result, DOGE remains locked inside a broad corrective structure with no clear sign of reversal.
Volume also reflects the slowdown. Trading activity is lower compared with the strong inflows during the early 2025 rally.
The recent candles show steady but muted participation, underscoring that momentum has shifted away from aggressive accumulation.
The RSI on the weekly timeframe sits around the high-30s, a level associated with weakening momentum but not yet oversold conditions.
That placement suggests room for further pressure unless DOGE stabilizes above nearby support levels.
The next major zone appears near 0.153 to 0.158 dollars, an area that held as resistance during late 2023 and early 2024 and now acts as potential support.
A weekly close below that band would further confirm the descending channel and could extend the move toward the lower boundary projected by the trendlines.
For the structure to change, DOGE would need to reclaim the channel’s upper trendline and the 50-week EMA. Only then would the chart show early signs of reversing back toward the Fibonacci zone it lost earlier in the cycle.
For now, the weekly chart illustrates a clear downtrend with DOGE moving steadily away from its previous golden-zone support and showing no confirmation of a broader shift in momentum.
Glassnode Data Shows Dogecoin’s Next Strong Support Near 0.081 Dollar
Dogecoin sits on thin on-chain support, with the next solid demand zone emerging much lower, according to analyst Ali using Glassnode data.
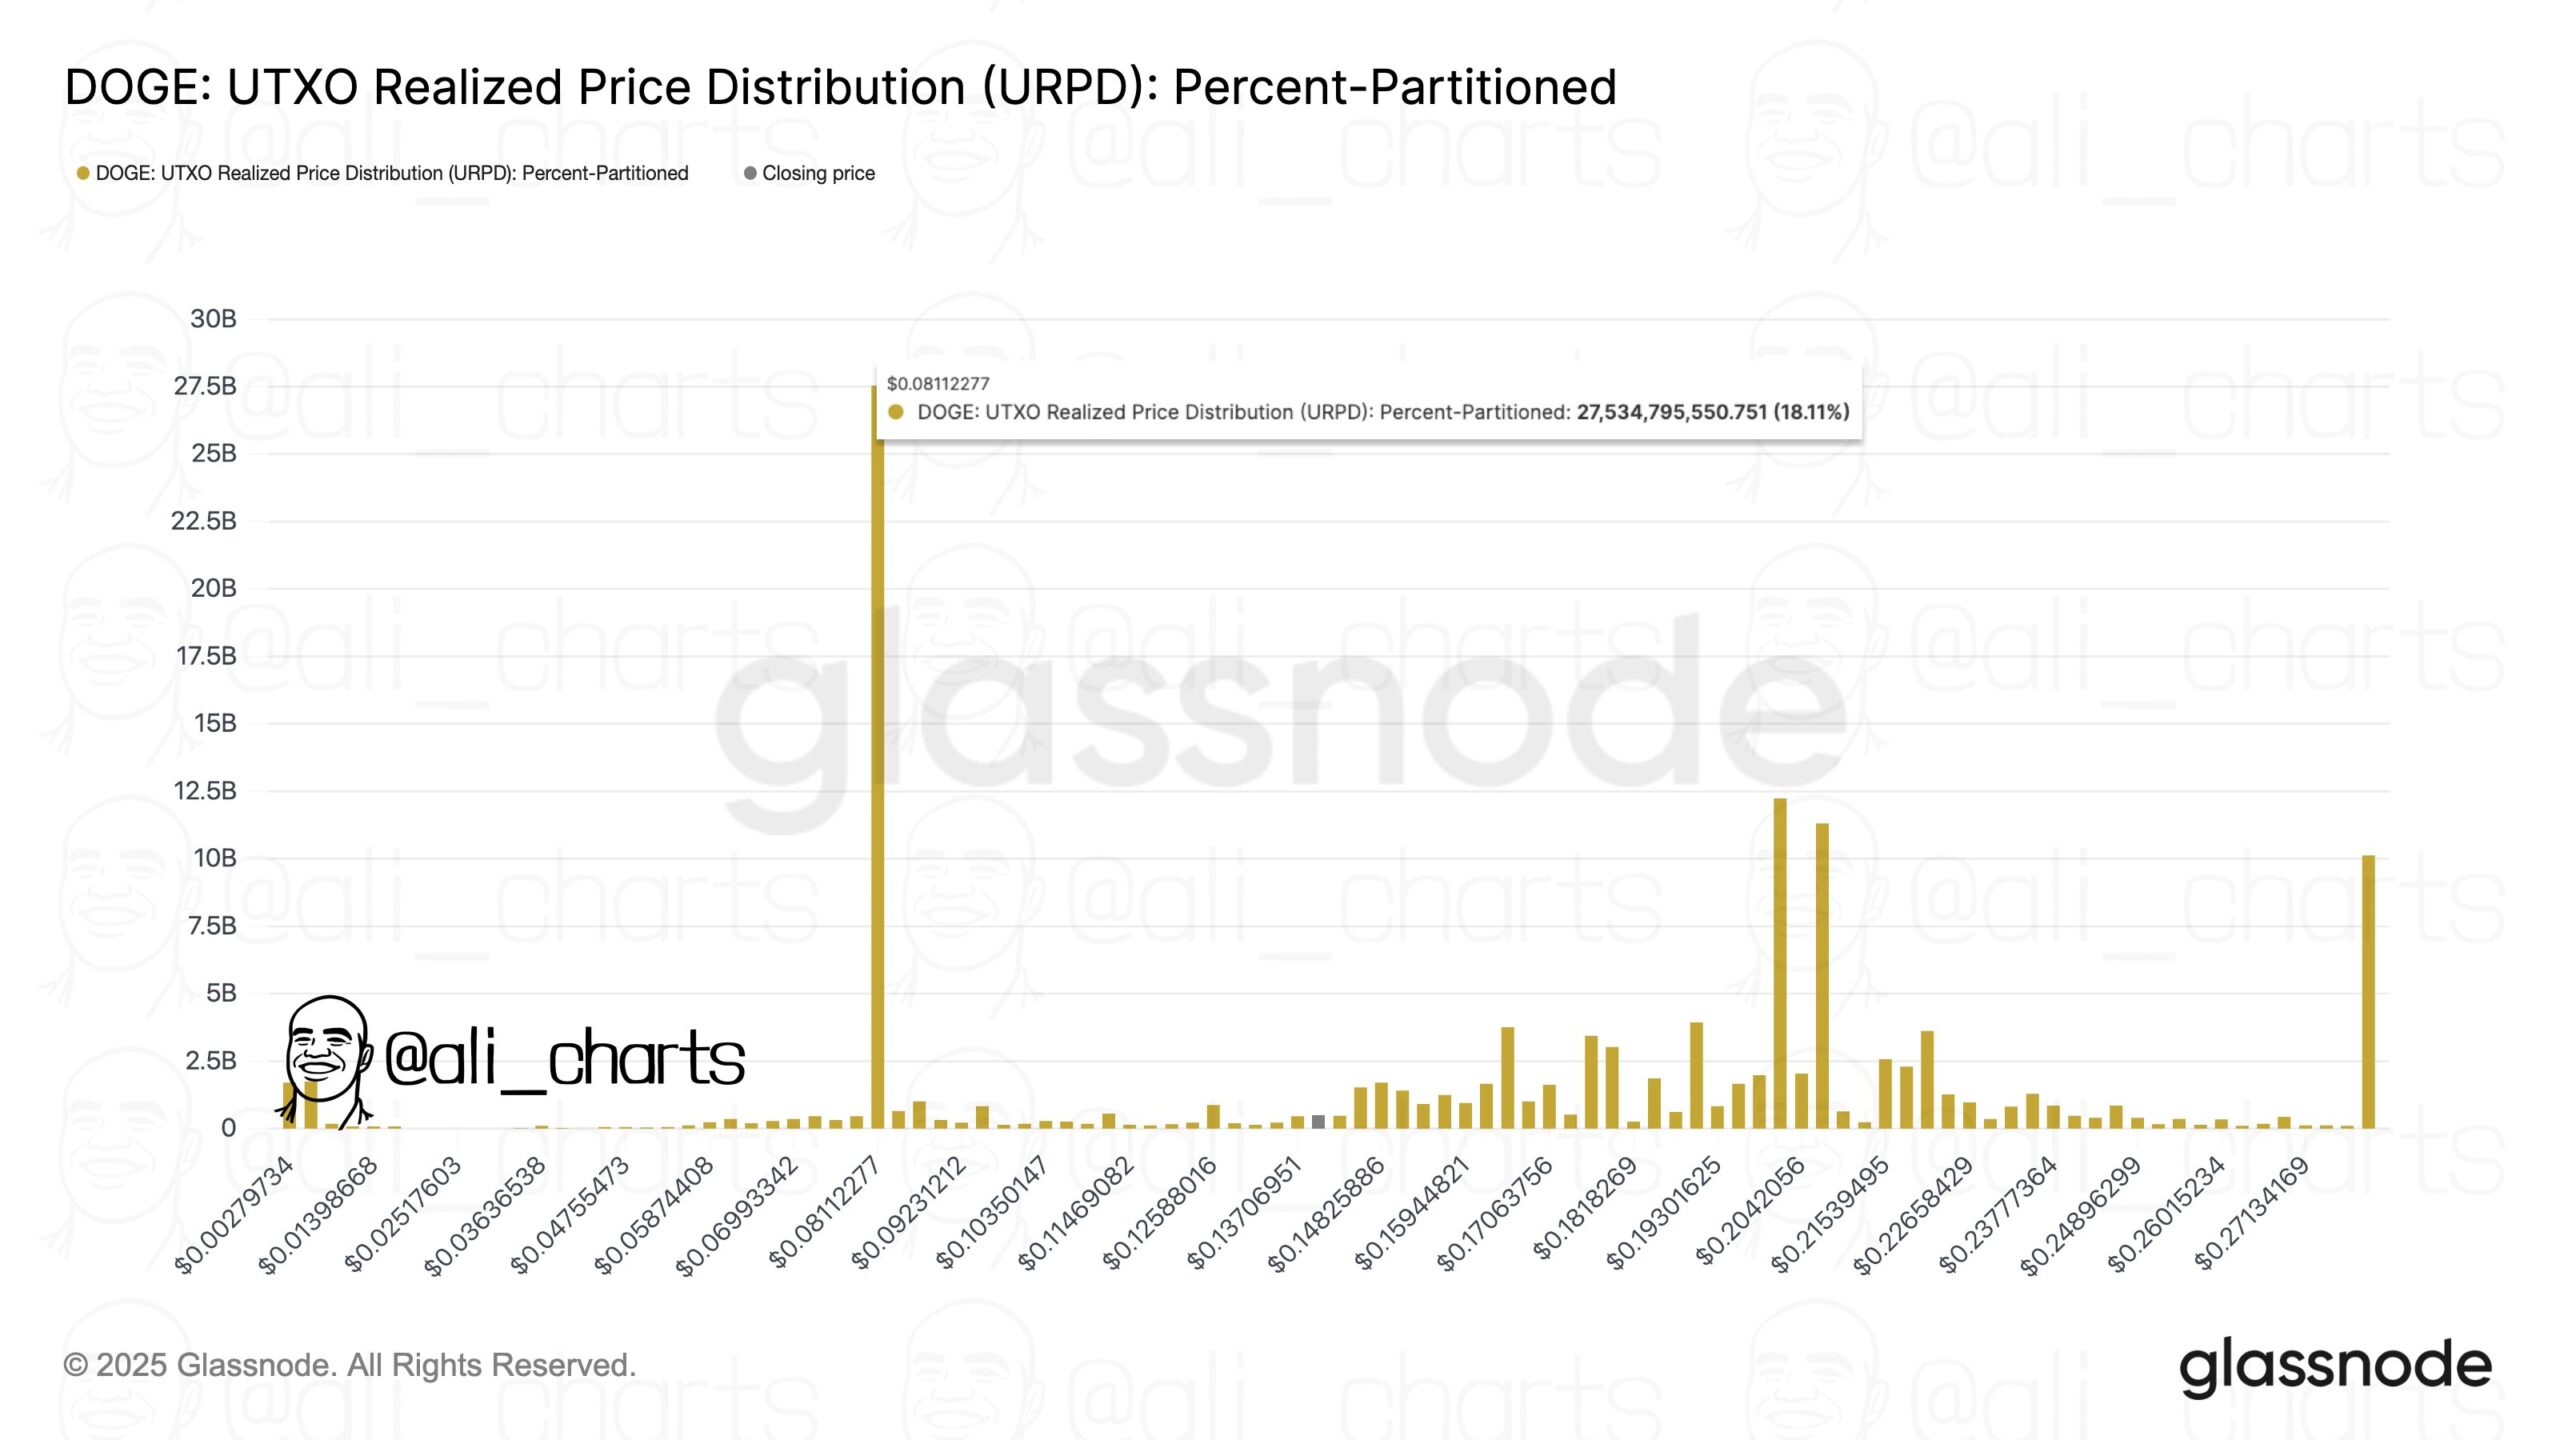
Ali, known as @ali_charts, highlighted Dogecoin’s UTXO Realized Price Distribution chart, which maps where coins last moved on the blockchain.
The bars on the chart show a limited volume of DOGE transacting around current prices, signaling weak realized-price support just below the market.
Further down the curve, however, the distribution thickens near 0.081 dollar, where a large share of supply last changed hands.
That cluster marks the next major support zone on-chain. If price breaks below the present area, the data suggest Dogecoin could gravitate toward that 0.081 dollar region, where more holders may be willing to defend their entries.
Disclosure:This article does not contain investment advice or recommendations. Every investment and trading move involves risk, and readers should conduct their own research when making a decision.
Kriptoworld.com accepts no liability for any errors in the articles or for any financial loss resulting from incorrect information.

Tatevik Avetisyan is an editor at Kriptoworld who covers emerging crypto trends, blockchain innovation, and altcoin developments. She is passionate about breaking down complex stories for a global audience and making digital finance more accessible.
📅 Published: December 8, 2025 • 🕓 Last updated: December 8, 2025
