


Bitcoin traded near $89,833 on Dec. 15, 2025, as the daily BTC USD chart showed price compressing between a falling trendline from the October peak and a rising support line from the mid November rebound.
The setup created a tightening triangle that often signals a volatility squeeze after a sharp move.
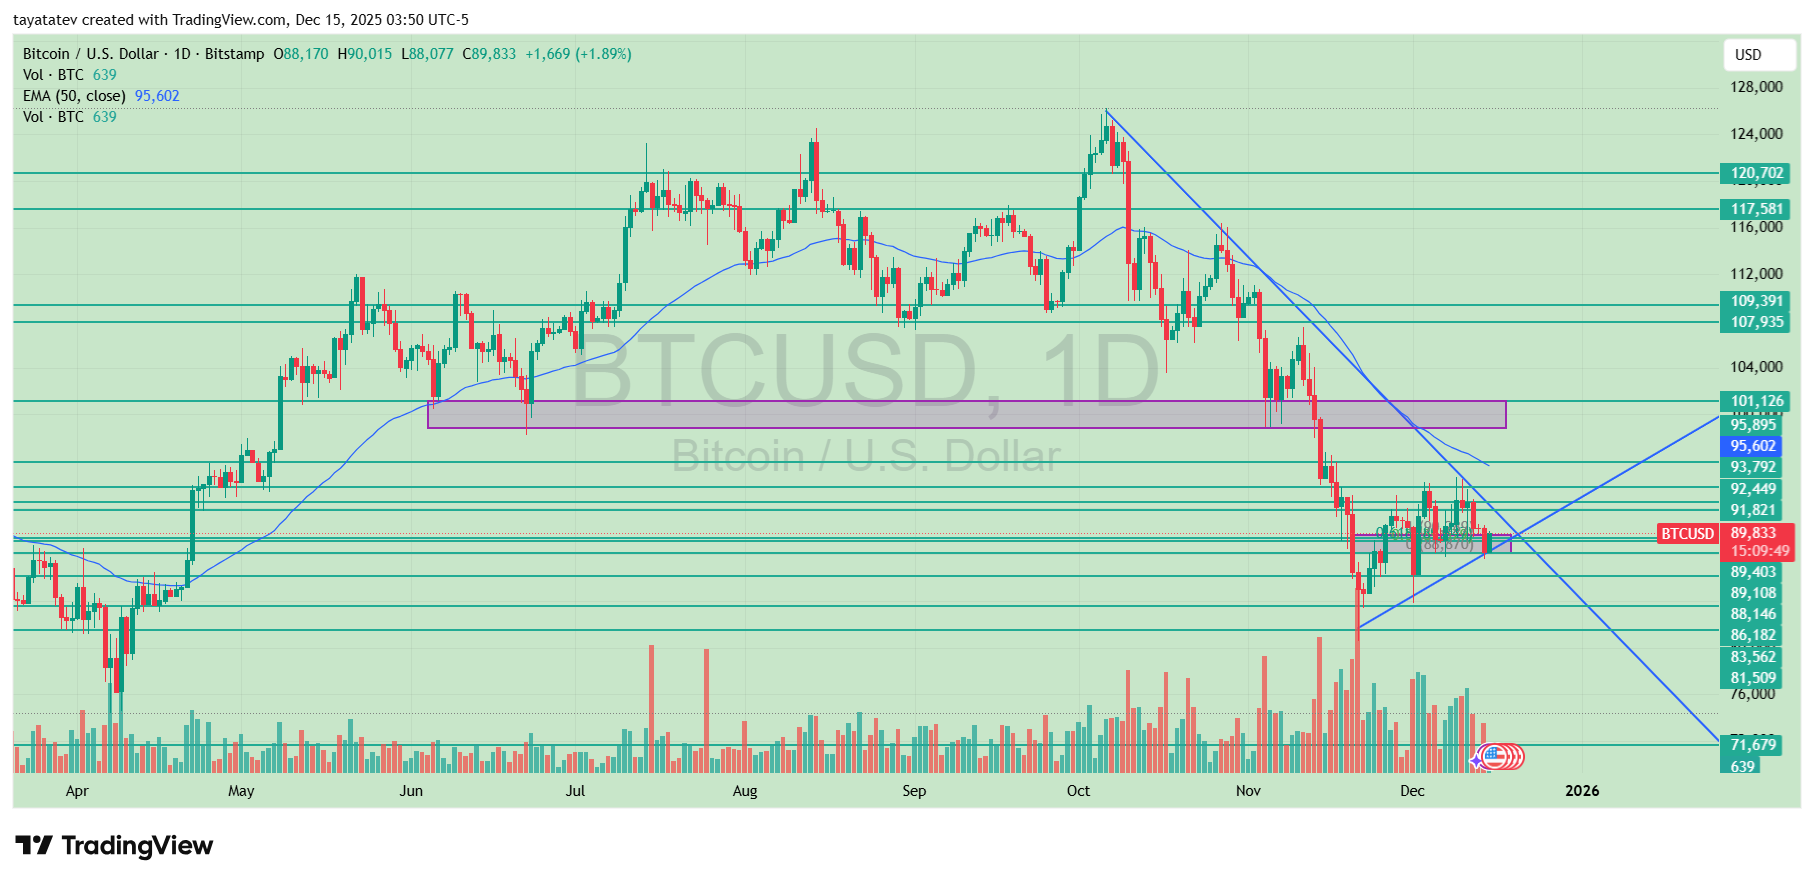
The chart showed Bitcoin dropping from the October top area near $124,000 and then sliding through several prior support bands.
Price later stabilized around the high $80,000s, where repeated tests of the $88,000 to $90,000 zone held.
On the session shown, BTC printed O $88,170, H $90,015, L $88,077, and C $89,833, a daily gain of about 1.89%.
Overhead, the market remained capped below the 50 day EMA near $95,602, which sat above price and aligned with nearby resistance bands around $93,792 and $95,895.
The chart also marked larger upside checkpoints higher up, including the former breakdown area around $101,126, which previously acted as a major pivot zone before the selloff accelerated.
On the downside, the same chart highlighted layered support levels under the consolidation, with nearby zones around $89,403, $88,146, and $86,182.
Below that, the next marked bands sat near $83,562 and $81,509, with deeper levels further down at $76,000 and $71,679.
In that context, the triangle reflected a market balancing between sellers defending the downtrend structure and buyers holding the late year base.
Bitcoin rebounds from $88,000 as chart targets $92,000 to $94,000 ceiling
Bitcoin retested the $88,000 support zone and rebounded on Dec. 15, 2025, as a daily BTC USDT chart on Binance showed buyers defending the latest base after the sharp November drop.
BTC last stood near $89,808, up about 1.86% on the day, after printing $88,172 open, $90,052 high, and $88,074 low on the session.
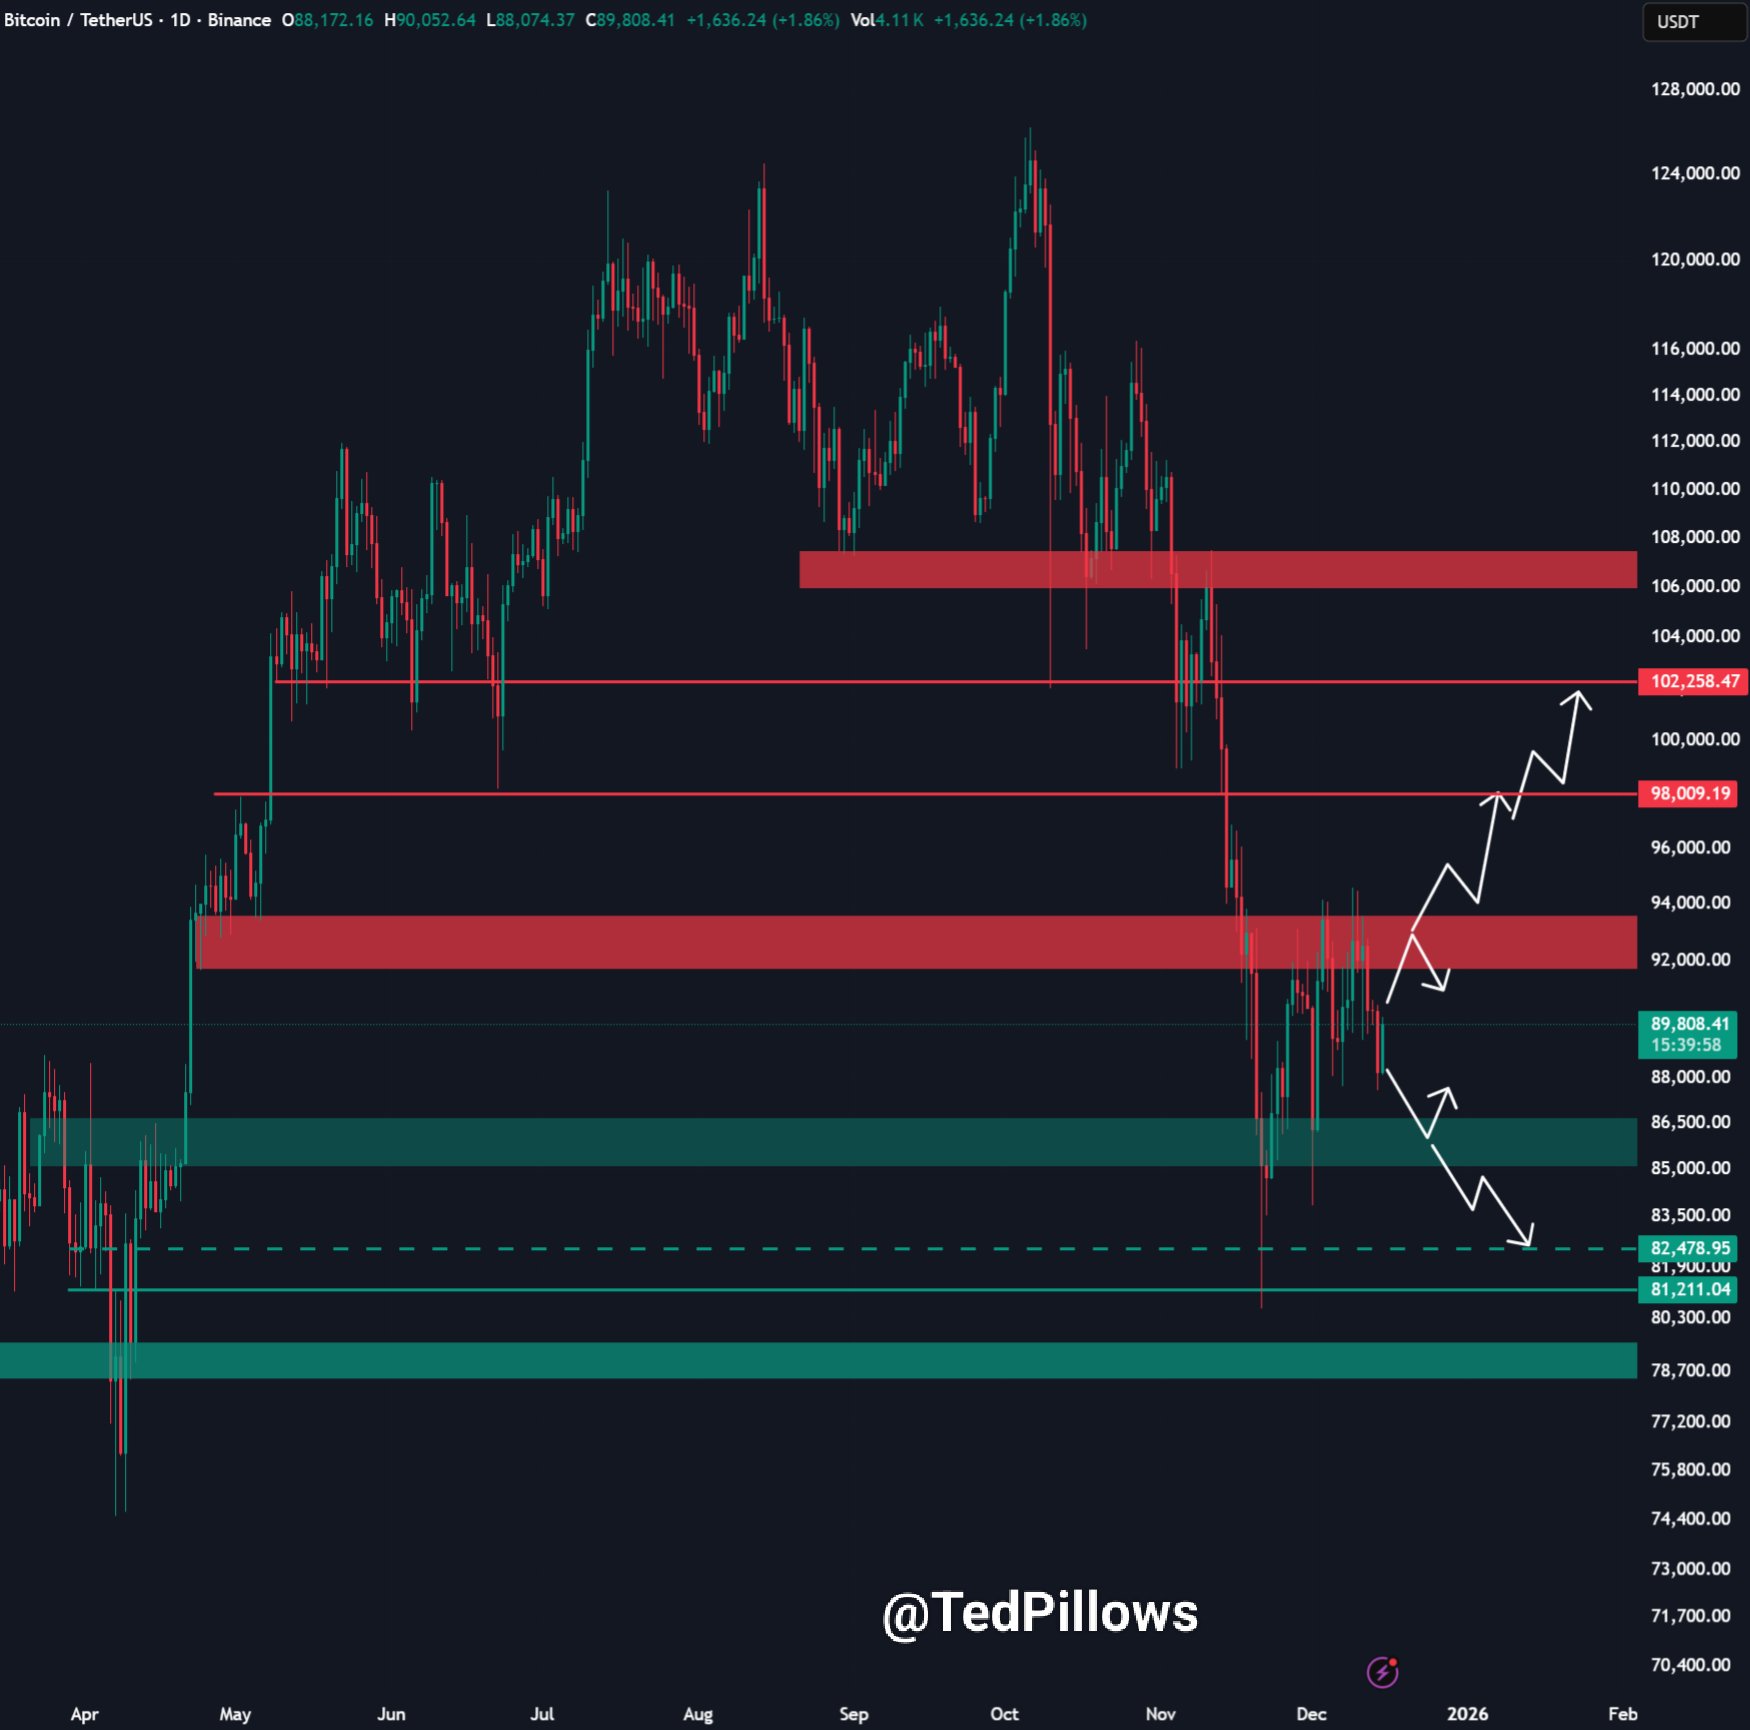
The chart marked the next overhead supply as a broad $92,000 to $94,000 resistance band, a zone BTC has struggled to reclaim during recent bounce attempts.
Price also sat below higher reference levels near $98,009 and $102,258, which the chart highlighted as additional upside checkpoints if BTC clears the first resistance cluster.
On the downside, the same chart mapped layered demand below spot, including a support band around the mid $80,000s, followed by a deeper zone near $82,479 to $81,211.
A wider support block appeared lower near the high $70,000s, which would come into focus if the rebound fades and BTC loses the current base.
Bitcoin liquidation heatmap shows clustered pressure zones on Dec. 15
Bitcoin’s 24 hour BTC USDT liquidation heatmap from Binance highlighted tightly packed leverage bands above and below the recent trading range on Dec. 15, 2025, pointing to areas where forced liquidations could accelerate the next directional move.
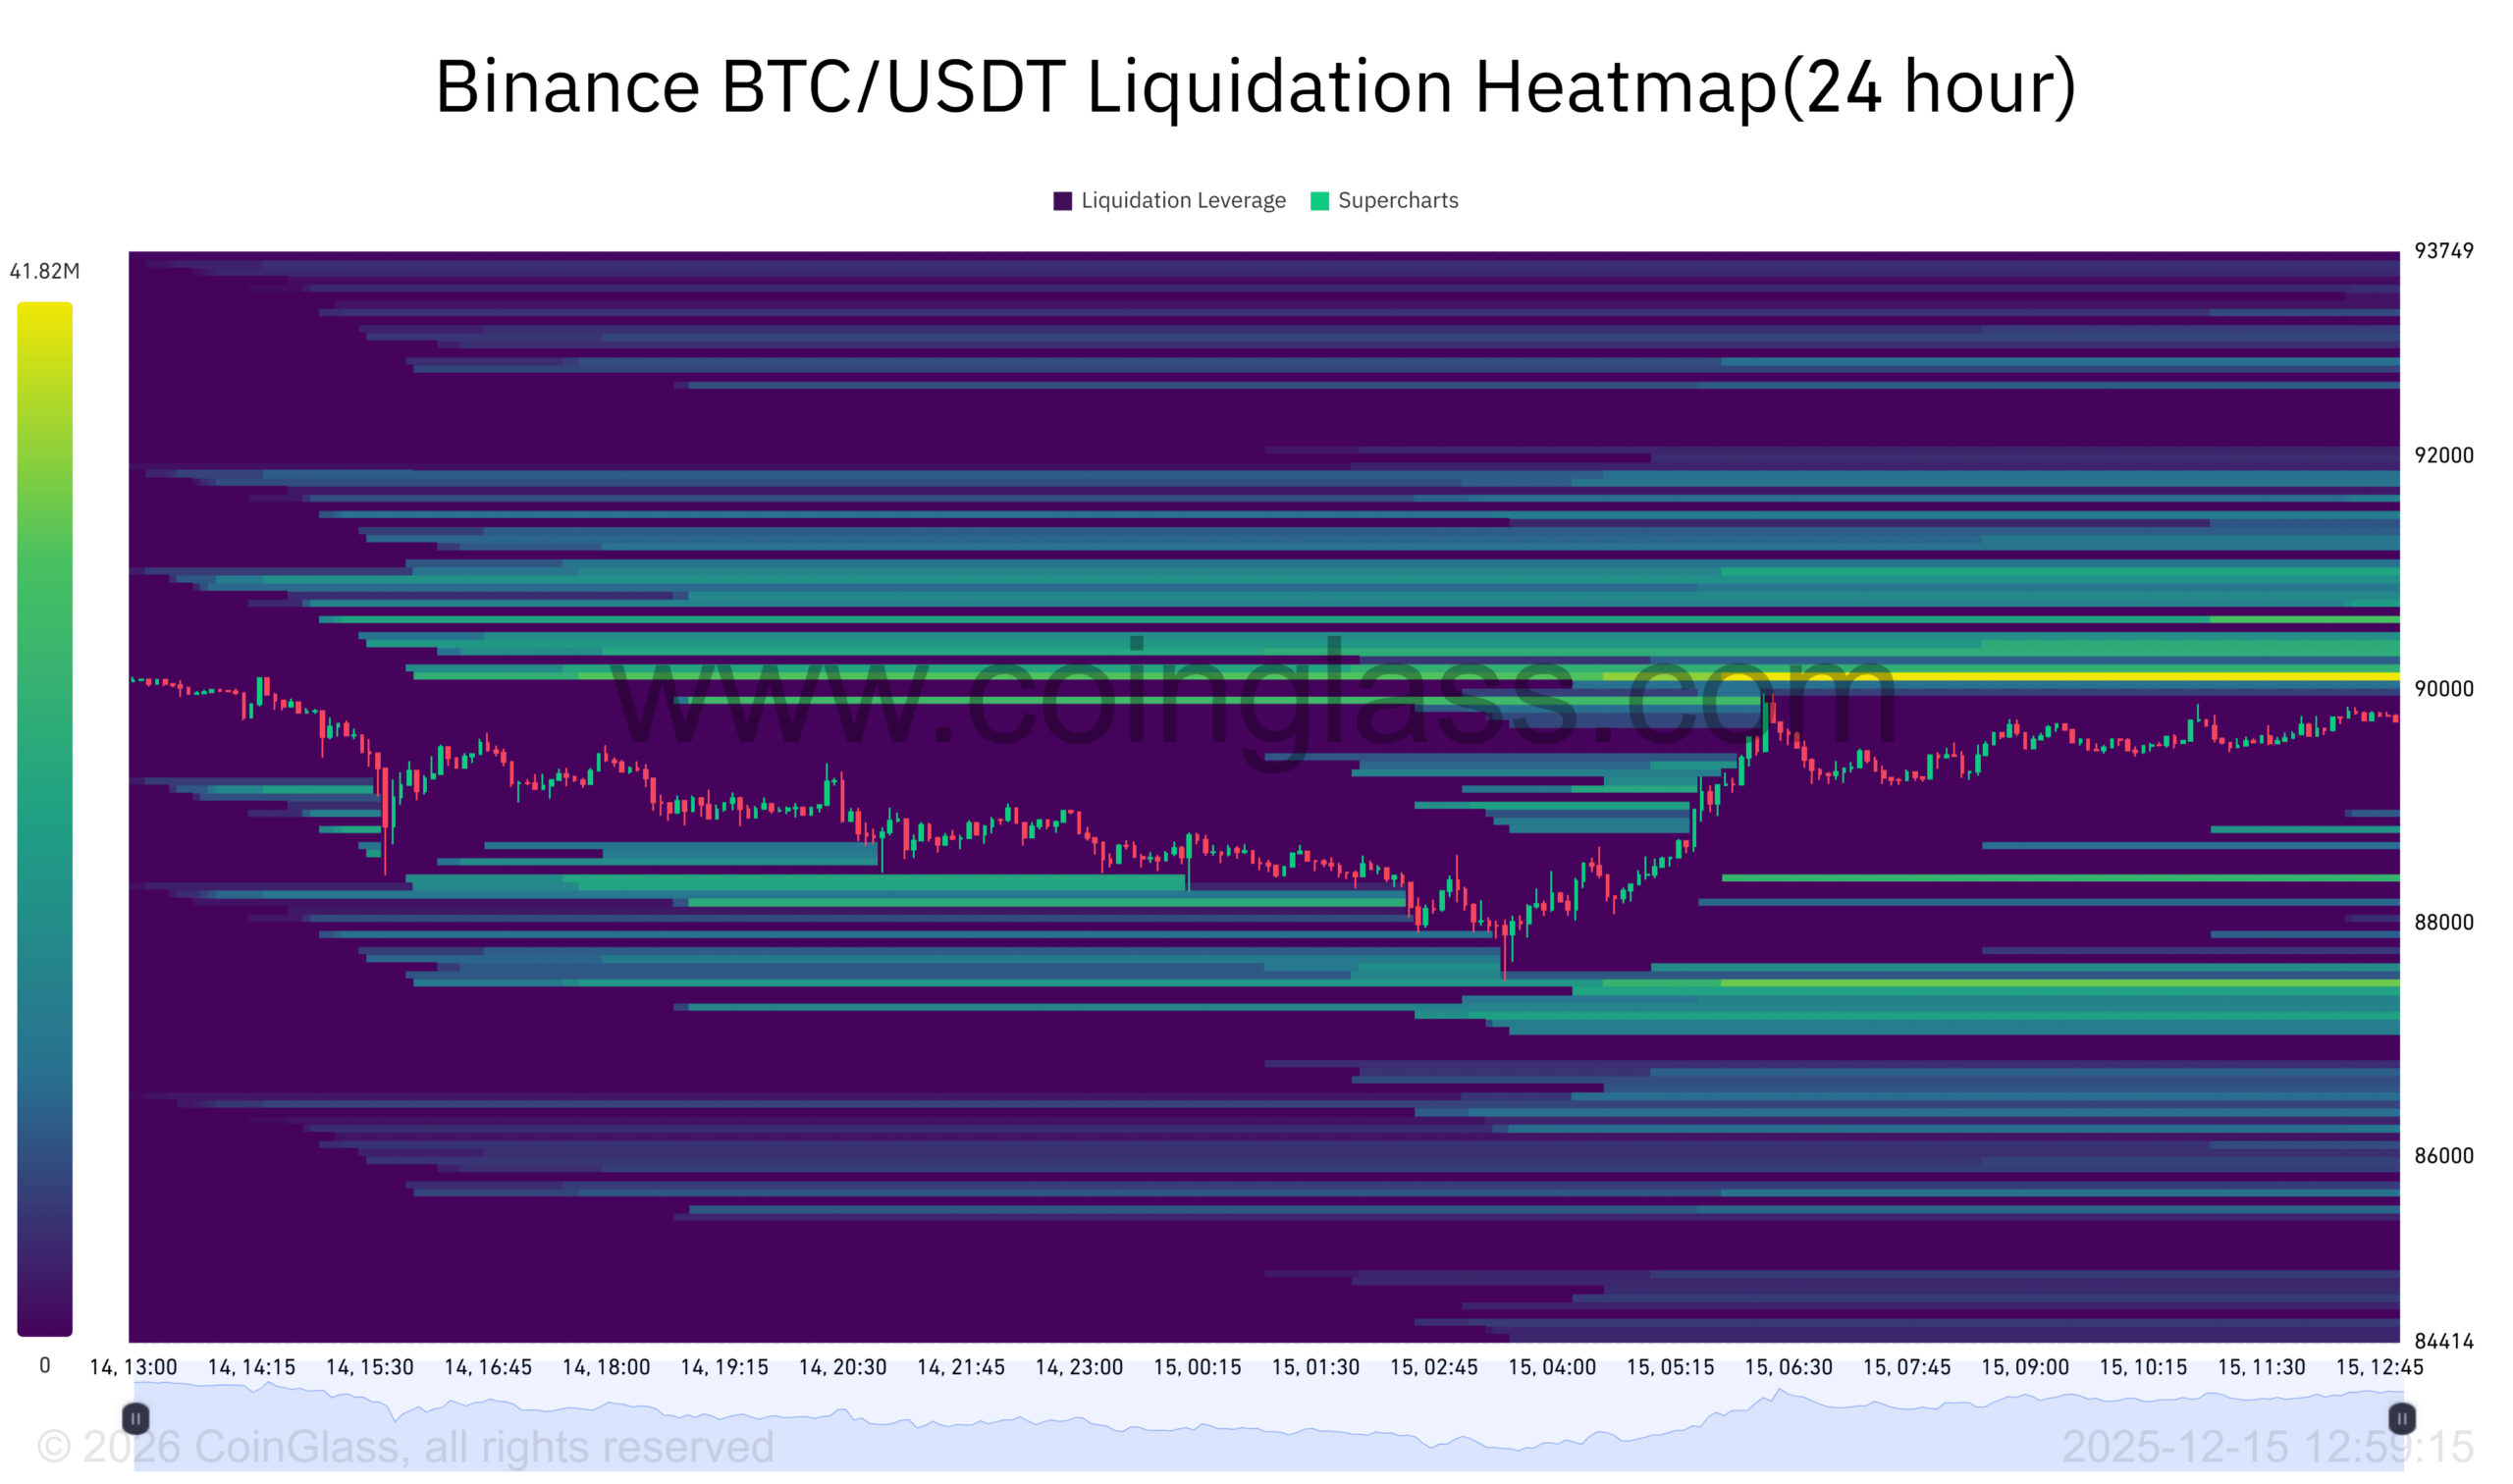
The chart showed the densest concentration of potential liquidations stacked above the market, with bright bands extending through the $90,000 area and rising toward roughly $92,000 to $93,700.
Those zones often attract price during upside moves, since liquidated short positions can trigger rapid buy orders once those levels are reached.
Below the range, the heatmap also displayed layered liquidation pools around $88,000, $87,000, and deeper near $86,000 to $84,500.
If price slips into those areas, long liquidations could cascade and add downside momentum, especially during periods of thin liquidity.
Overall, the heatmap structure reflected a market compressed between opposing leverage clusters.
With liquidation liquidity built on both sides, any expansion away from the current range could be amplified by derivatives positioning rather than spot flows.
Disclosure:This article does not contain investment advice or recommendations. Every investment and trading move involves risk, and readers should conduct their own research when making a decision.
Kriptoworld.com accepts no liability for any errors in the articles or for any financial loss resulting from incorrect information.

Tatevik Avetisyan is an editor at Kriptoworld who covers emerging crypto trends, blockchain innovation, and altcoin developments. She is passionate about breaking down complex stories for a global audience and making digital finance more accessible.
📅 Published: December 15, 2025 • 🕓 Last updated: December 15, 2025
