


Ethereum continued to trade under pressure on the daily ETH USD chart on Dec. 25, as price compressed into a clear bearish pennant formation after a prolonged decline.
ETH hovered near $2,940 at the time of the snapshot, failing to reclaim the 50 day exponential moving average near $3,166.
Stay ahead in the crypto world – follow us on X for the latest updates, insights, and trends!🚀
That level has capped multiple recovery attempts since November, keeping the broader structure tilted to the downside.
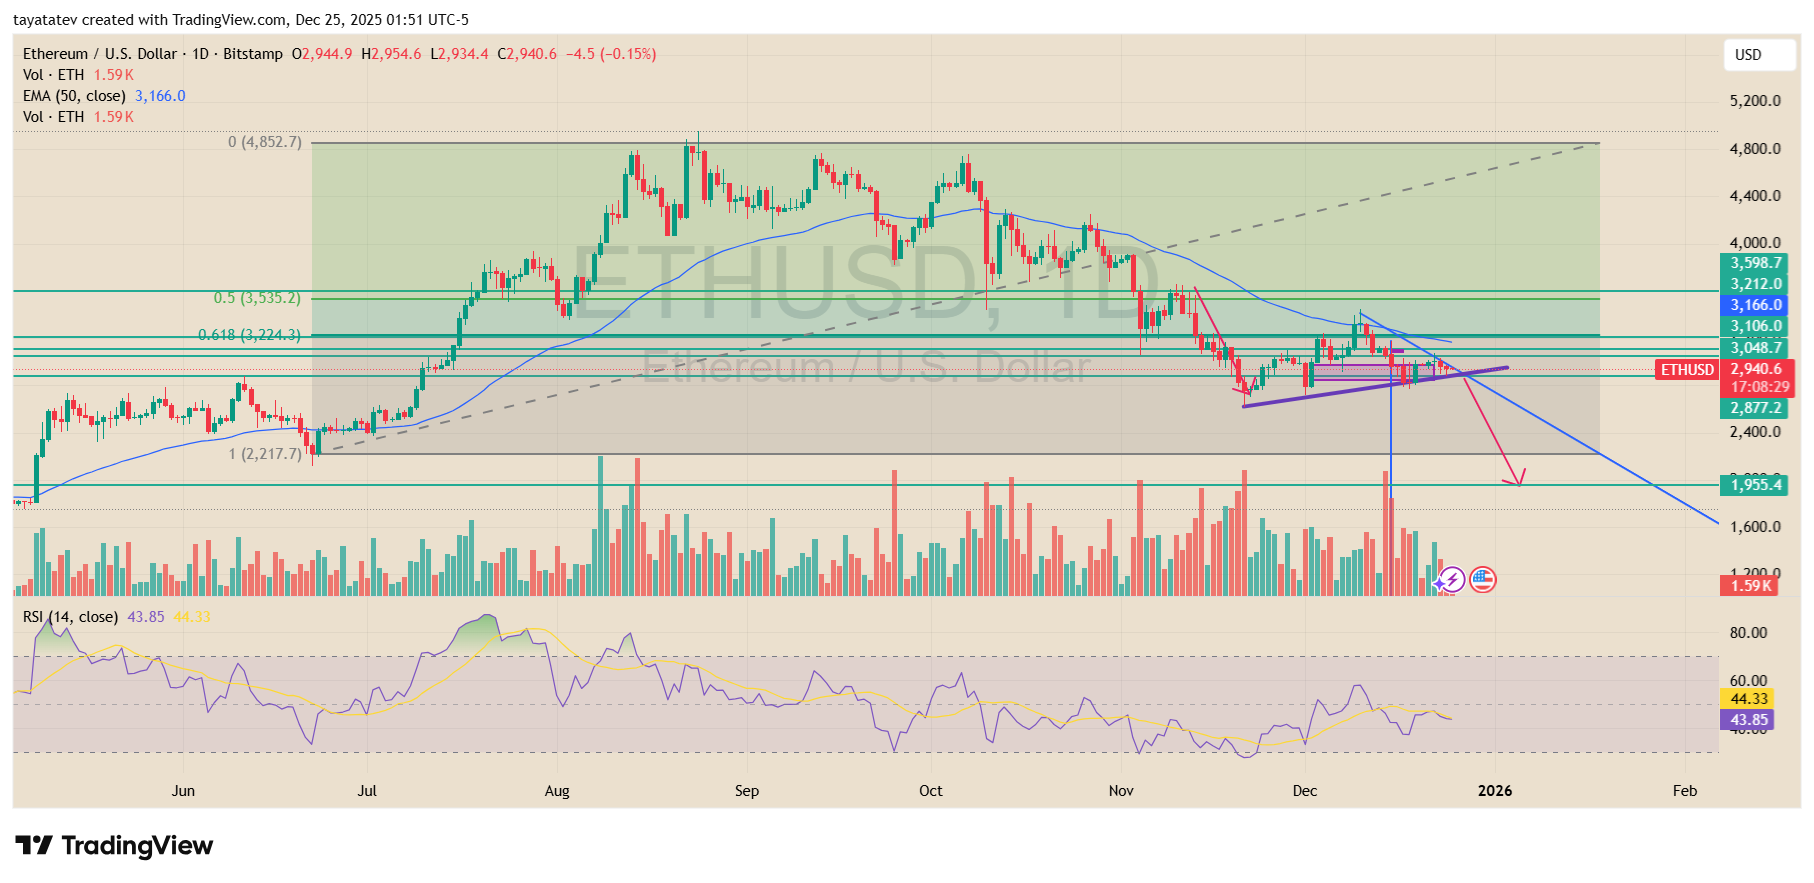
Earlier in the year, Ethereum topped near the $4,800 area before rolling over into a sustained downtrend. Since then, price has printed a series of lower highs and lower lows.
The sharp sell off into late November formed the flagpole of the pattern, followed by a tight consolidation marked by converging trendlines. This narrowing range reflects slowing momentum rather than renewed demand.
A bearish pennant is a continuation pattern that appears after a strong decline. It forms when price consolidates in a small symmetrical triangle, with buyers and sellers temporarily balanced.
However, this pause usually resolves in the direction of the prior move. In Ethereum’s case, the prior move was decisively lower, which keeps downside risk elevated as long as price remains below resistance.
On the chart, ETH continues to trade beneath key Fibonacci retracement levels around $3,048 and $3,106. Volume has also declined during consolidation, which aligns with typical bearish pennant behavior.
Meanwhile, the relative strength index sits in the low 40s, showing weak momentum without signaling a strong reversal.
If the bearish pennant confirms with a decisive breakdown, the pattern projects a move equal to the height of the prior decline.
Based on current levels, that implies a potential drop of roughly 34% from the $2,940 area. Such a move would place Ethereum near the $1,950 region, which aligns with a major horizontal support zone visible on the chart.
For now, Ethereum remains trapped inside the pennant structure. As a result, price action around the lower trendline will be critical.
A breakdown would confirm the continuation setup, while a sustained move back above the 50 day EMA would weaken the bearish case.
Ethereum Traces Inverse Head and Shoulders as Price Holds Key Support
Ethereum traded near $2,924 on the weekly ETH USD chart on Dec. 24, with price action carving out a visible inverse head and shoulders structure after a prolonged decline.
The pattern developed over several months, following a deep sell off that pushed ETH toward the $1,600–$1,700 area before buyers stepped back in.
Since then, price has stabilized and begun forming a base, suggesting selling pressure has eased.
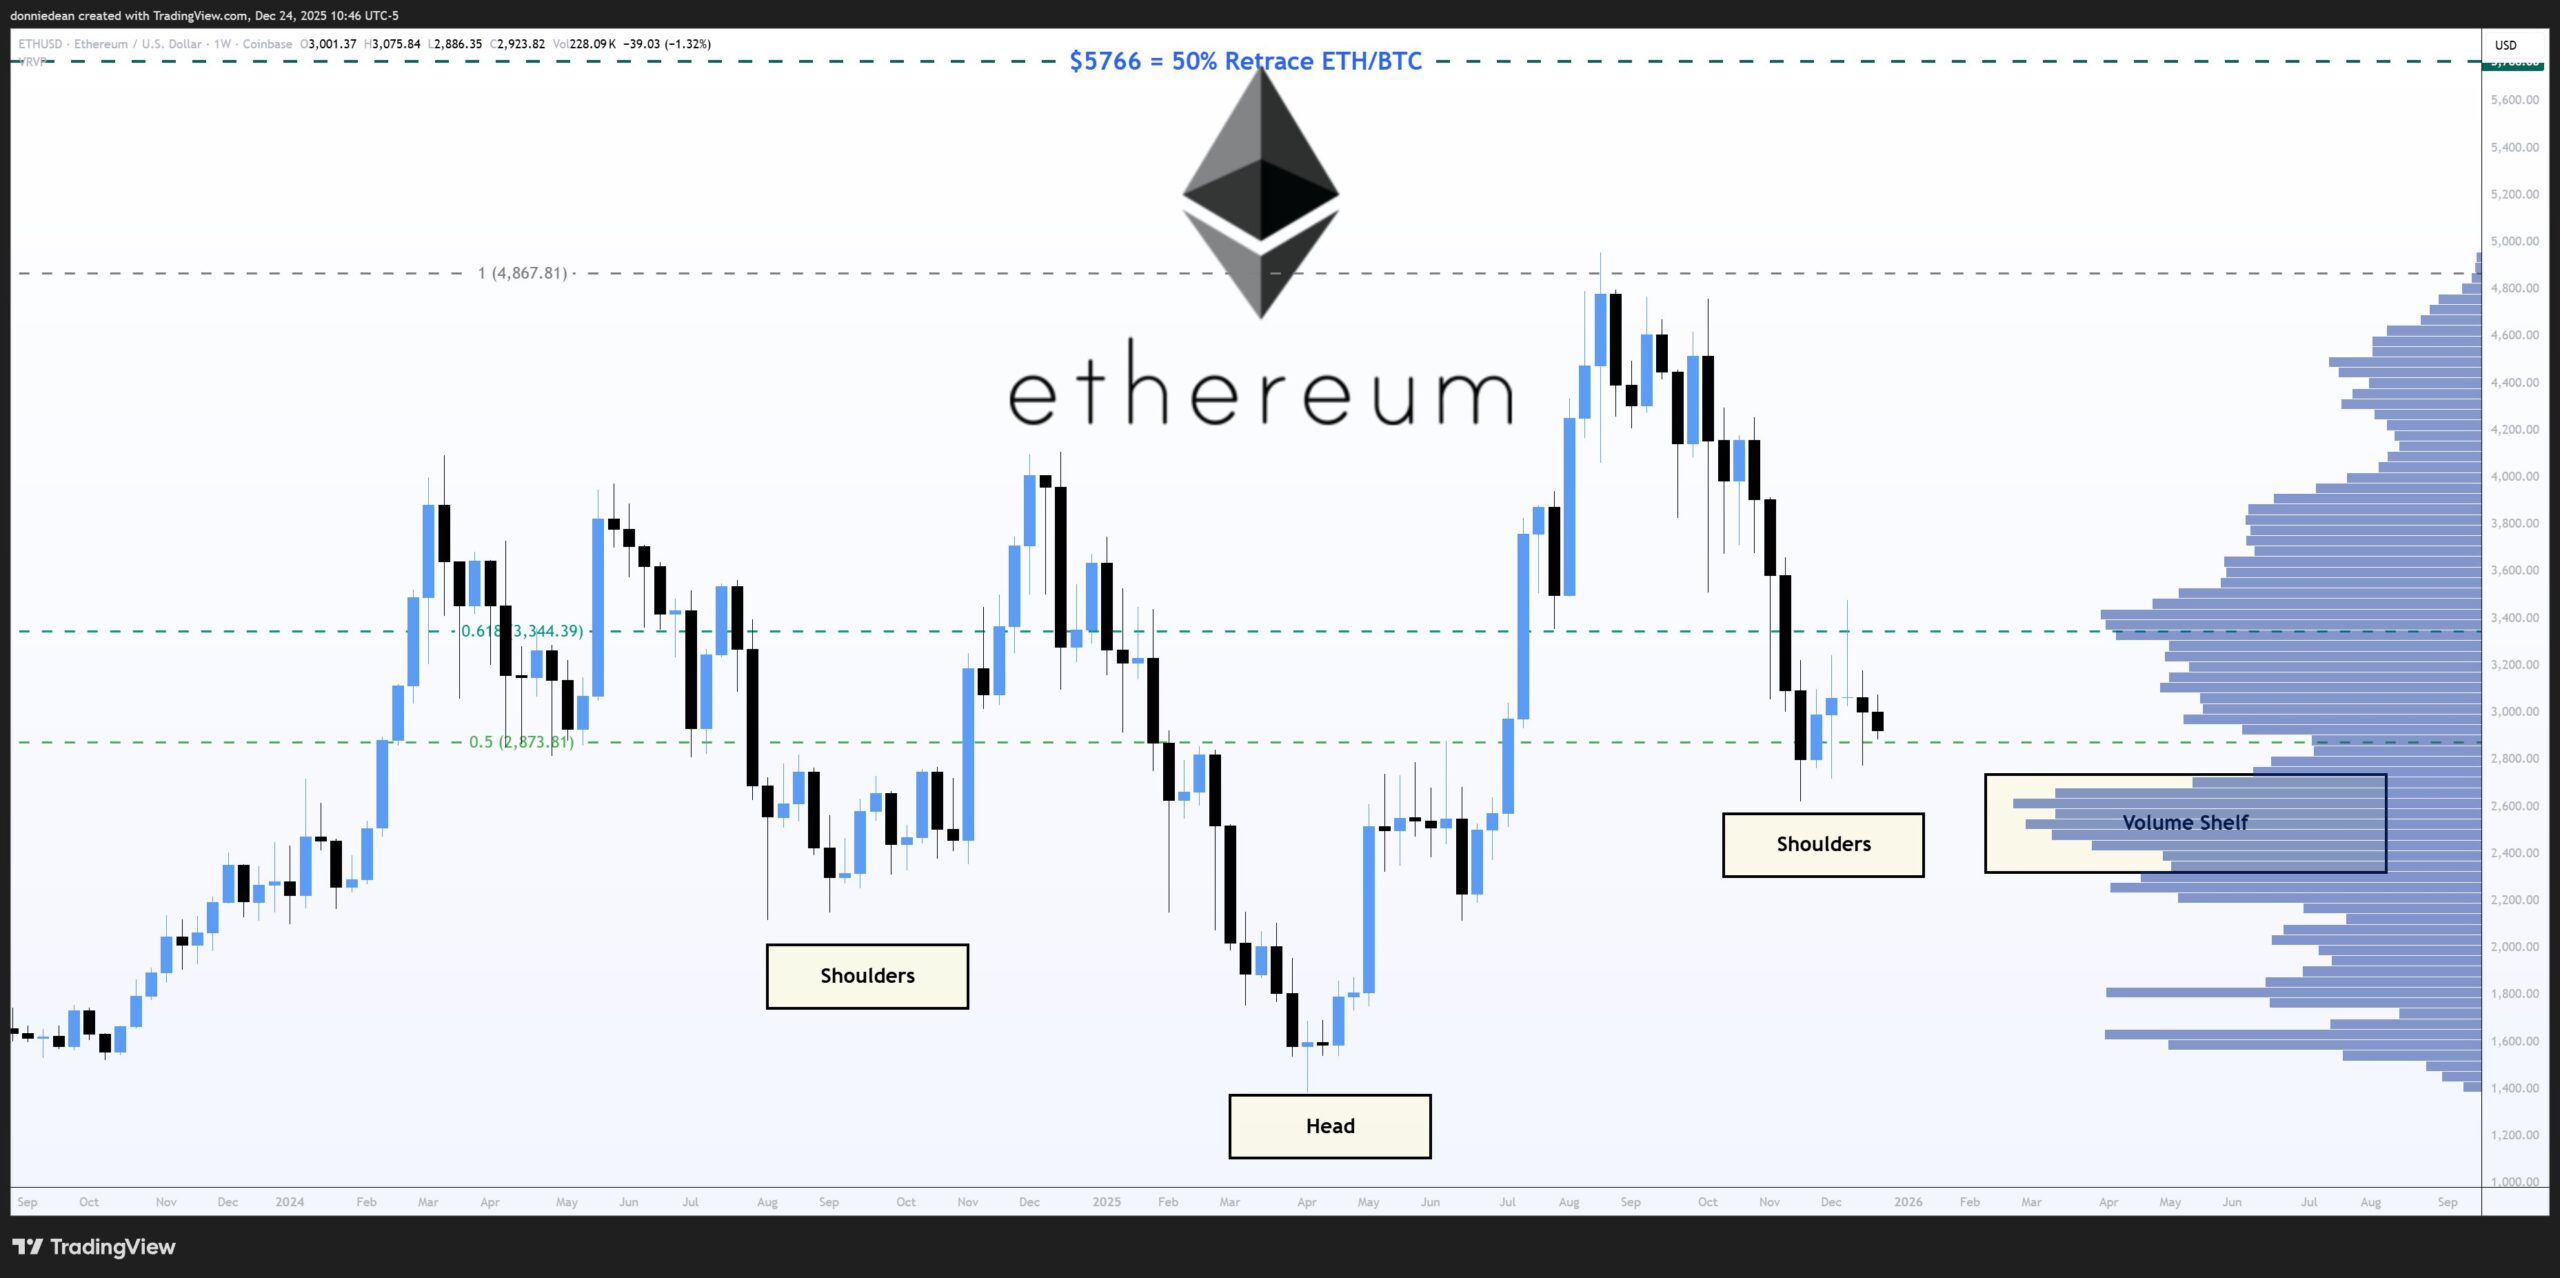
The chart shows a clear head formed at the cycle low in early 2025, followed by two higher troughs that define the left and right shoulders.
Each shoulder formed above the prior low, signaling gradual improvement in downside control. Meanwhile, price has repeatedly stalled below the $3,400 area, which now acts as the neckline of the formation.
An inverse head and shoulders is a reversal pattern that typically appears after a downtrend. It reflects a shift in market structure, where sellers fail to push price to new lows while buyers defend higher levels.
When confirmed, the pattern often signals a transition from bearish to neutral or bullish conditions. However, confirmation only occurs if price breaks and holds above the neckline.
On this chart, the neckline aligns closely with both a prior Fibonacci retracement level and a visible volume shelf.
That overlap strengthens the importance of the $3,400 zone, as it represents an area where significant trading activity previously occurred.
Volume has also contracted during the right shoulder, which is consistent with typical inverse head and shoulders behavior.
As long as Ethereum remains below the neckline, the pattern stays incomplete. A sustained move above $3,400 would confirm the structure and shift focus higher, while rejection at that level would keep price range bound.
For now, Ethereum continues to consolidate between established support and resistance, with the broader trend hinging on whether buyers can reclaim the neckline.
Disclosure:This article does not contain investment advice or recommendations. Every investment and trading move involves risk, and readers should conduct their own research when making a decision.
Kriptoworld.com accepts no liability for any errors in the articles or for any financial loss resulting from incorrect information.

Tatevik Avetisyan is an editor at Kriptoworld who covers emerging crypto trends, blockchain innovation, and altcoin developments. She is passionate about breaking down complex stories for a global audience and making digital finance more accessible.
📅 Published: December 25, 2025 • 🕓 Last updated: December 25, 2025
