


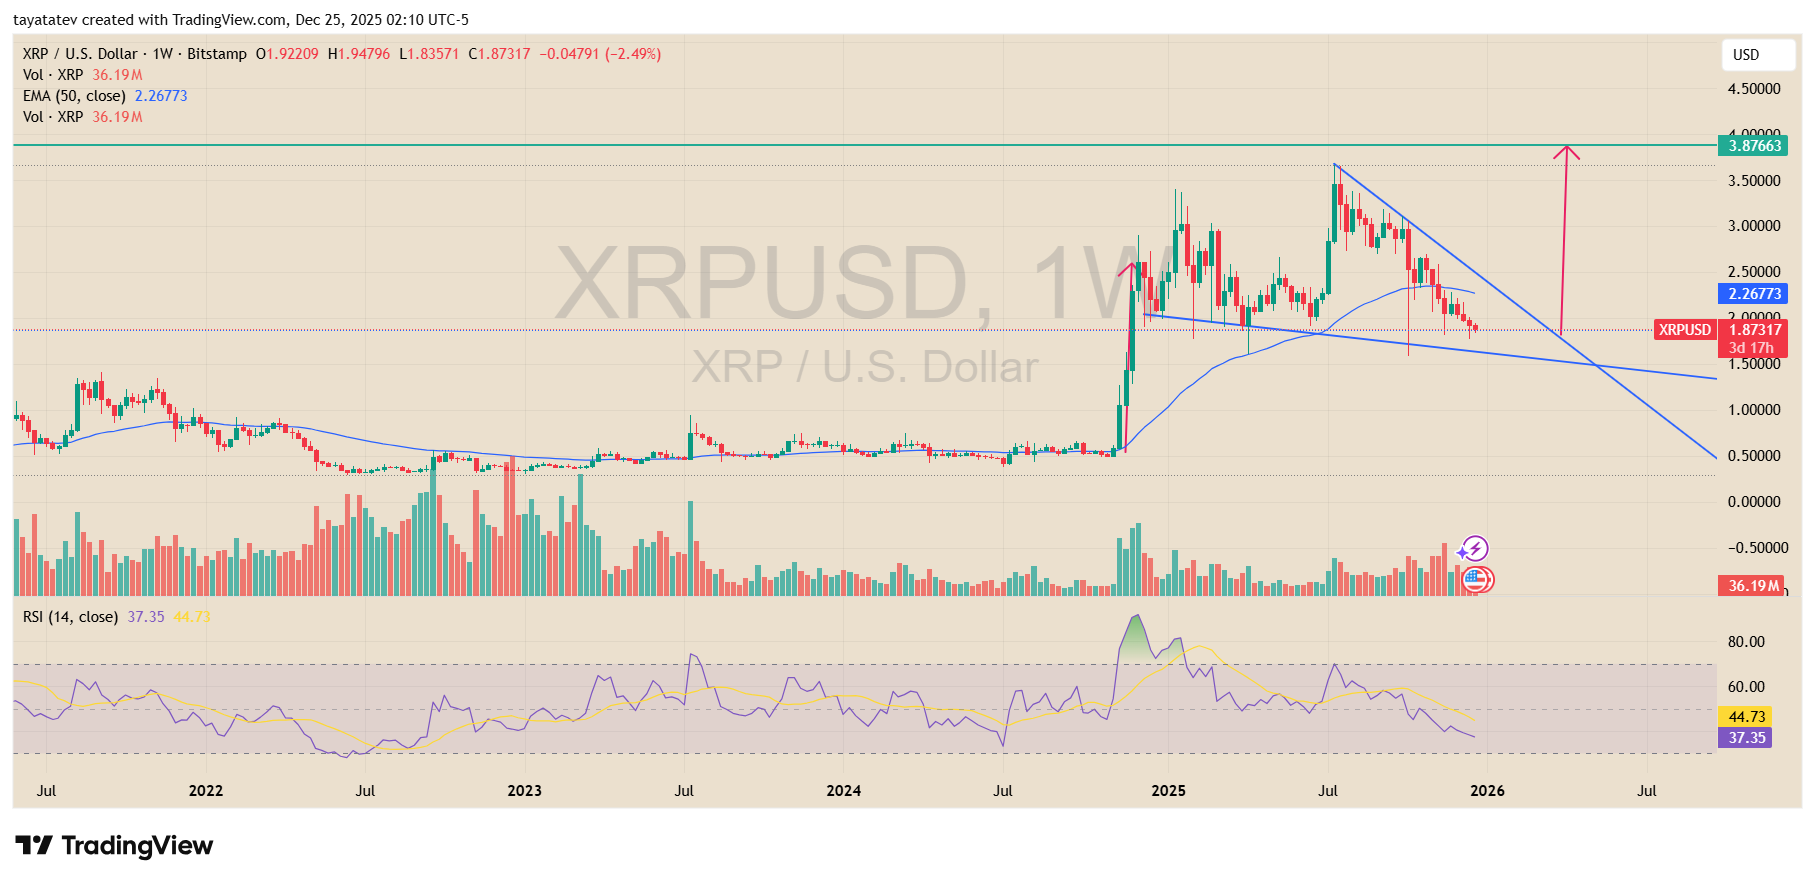
XRP has carved out a falling wedge pattern on the weekly XRP U.S. dollar chart, based on TradingView data from Bitstamp dated Dec. 25, 2025.
Price traded near $1.87 at the time of the snapshot, after weeks of lower highs and lower lows compressed inside two converging downward trendlines.
Stay ahead in the crypto world – follow us on X for the latest updates, insights, and trends!🚀
This structure developed following the sharp rally earlier in 2025, when XRP surged above the $3.00 area before entering a prolonged corrective phase.
A falling wedge is a technical pattern that forms when price trends lower but the range tightens over time.
Although price moves down, selling pressure gradually weakens, as shown by the narrowing slope of the highs and lows.
This setup often signals a potential bullish reversal once price breaks above the upper trendline, especially when it appears after a strong prior advance rather than a long downtrend.
On the weekly chart, XRP’s wedge sits above the rising 50 week exponential moving average, which hovered near $2.26. That moving average has started to flatten, suggesting that downside momentum has slowed.
At the same time, the relative strength index stayed below the neutral 50 level, with the latest reading near the high 30s, reflecting consolidation rather than aggressive selling.
Volume also remained muted during the wedge formation, which typically aligns with falling wedge behavior as market participation contracts before a directional move.
If XRP confirms a breakout above the upper boundary of the falling wedge, the technical structure points to a potential upside continuation.
Measured move projections based on the height of the prior rally place a possible target near $3.87. From the current price around $1.87, that level would represent a move of roughly 106 percent.
This target also aligns with a prior resistance zone marked earlier in the cycle, where price previously stalled before reversing lower.
However, until XRP breaks decisively above the wedge resistance, the pattern remains unconfirmed. Price continues to trade within the converging range, leaving the market in a compression phase.
A sustained weekly close above the descending trendline would be required to validate the bullish scenario implied by the falling wedge structure.
XRP Chart Shows Expanded Flat Setup After Fifth Wave Overlap
XRP traded near $1.865 on the daily XRP U.S. dollar chart on Coinbase, based on a TradingView snapshot created Dec. 24, 2025.
The chart showed XRP sliding from a mid 2025 peak above $3.50 into a steady decline, while price held near a horizontal support zone around the high $1.70s to low $1.80s.
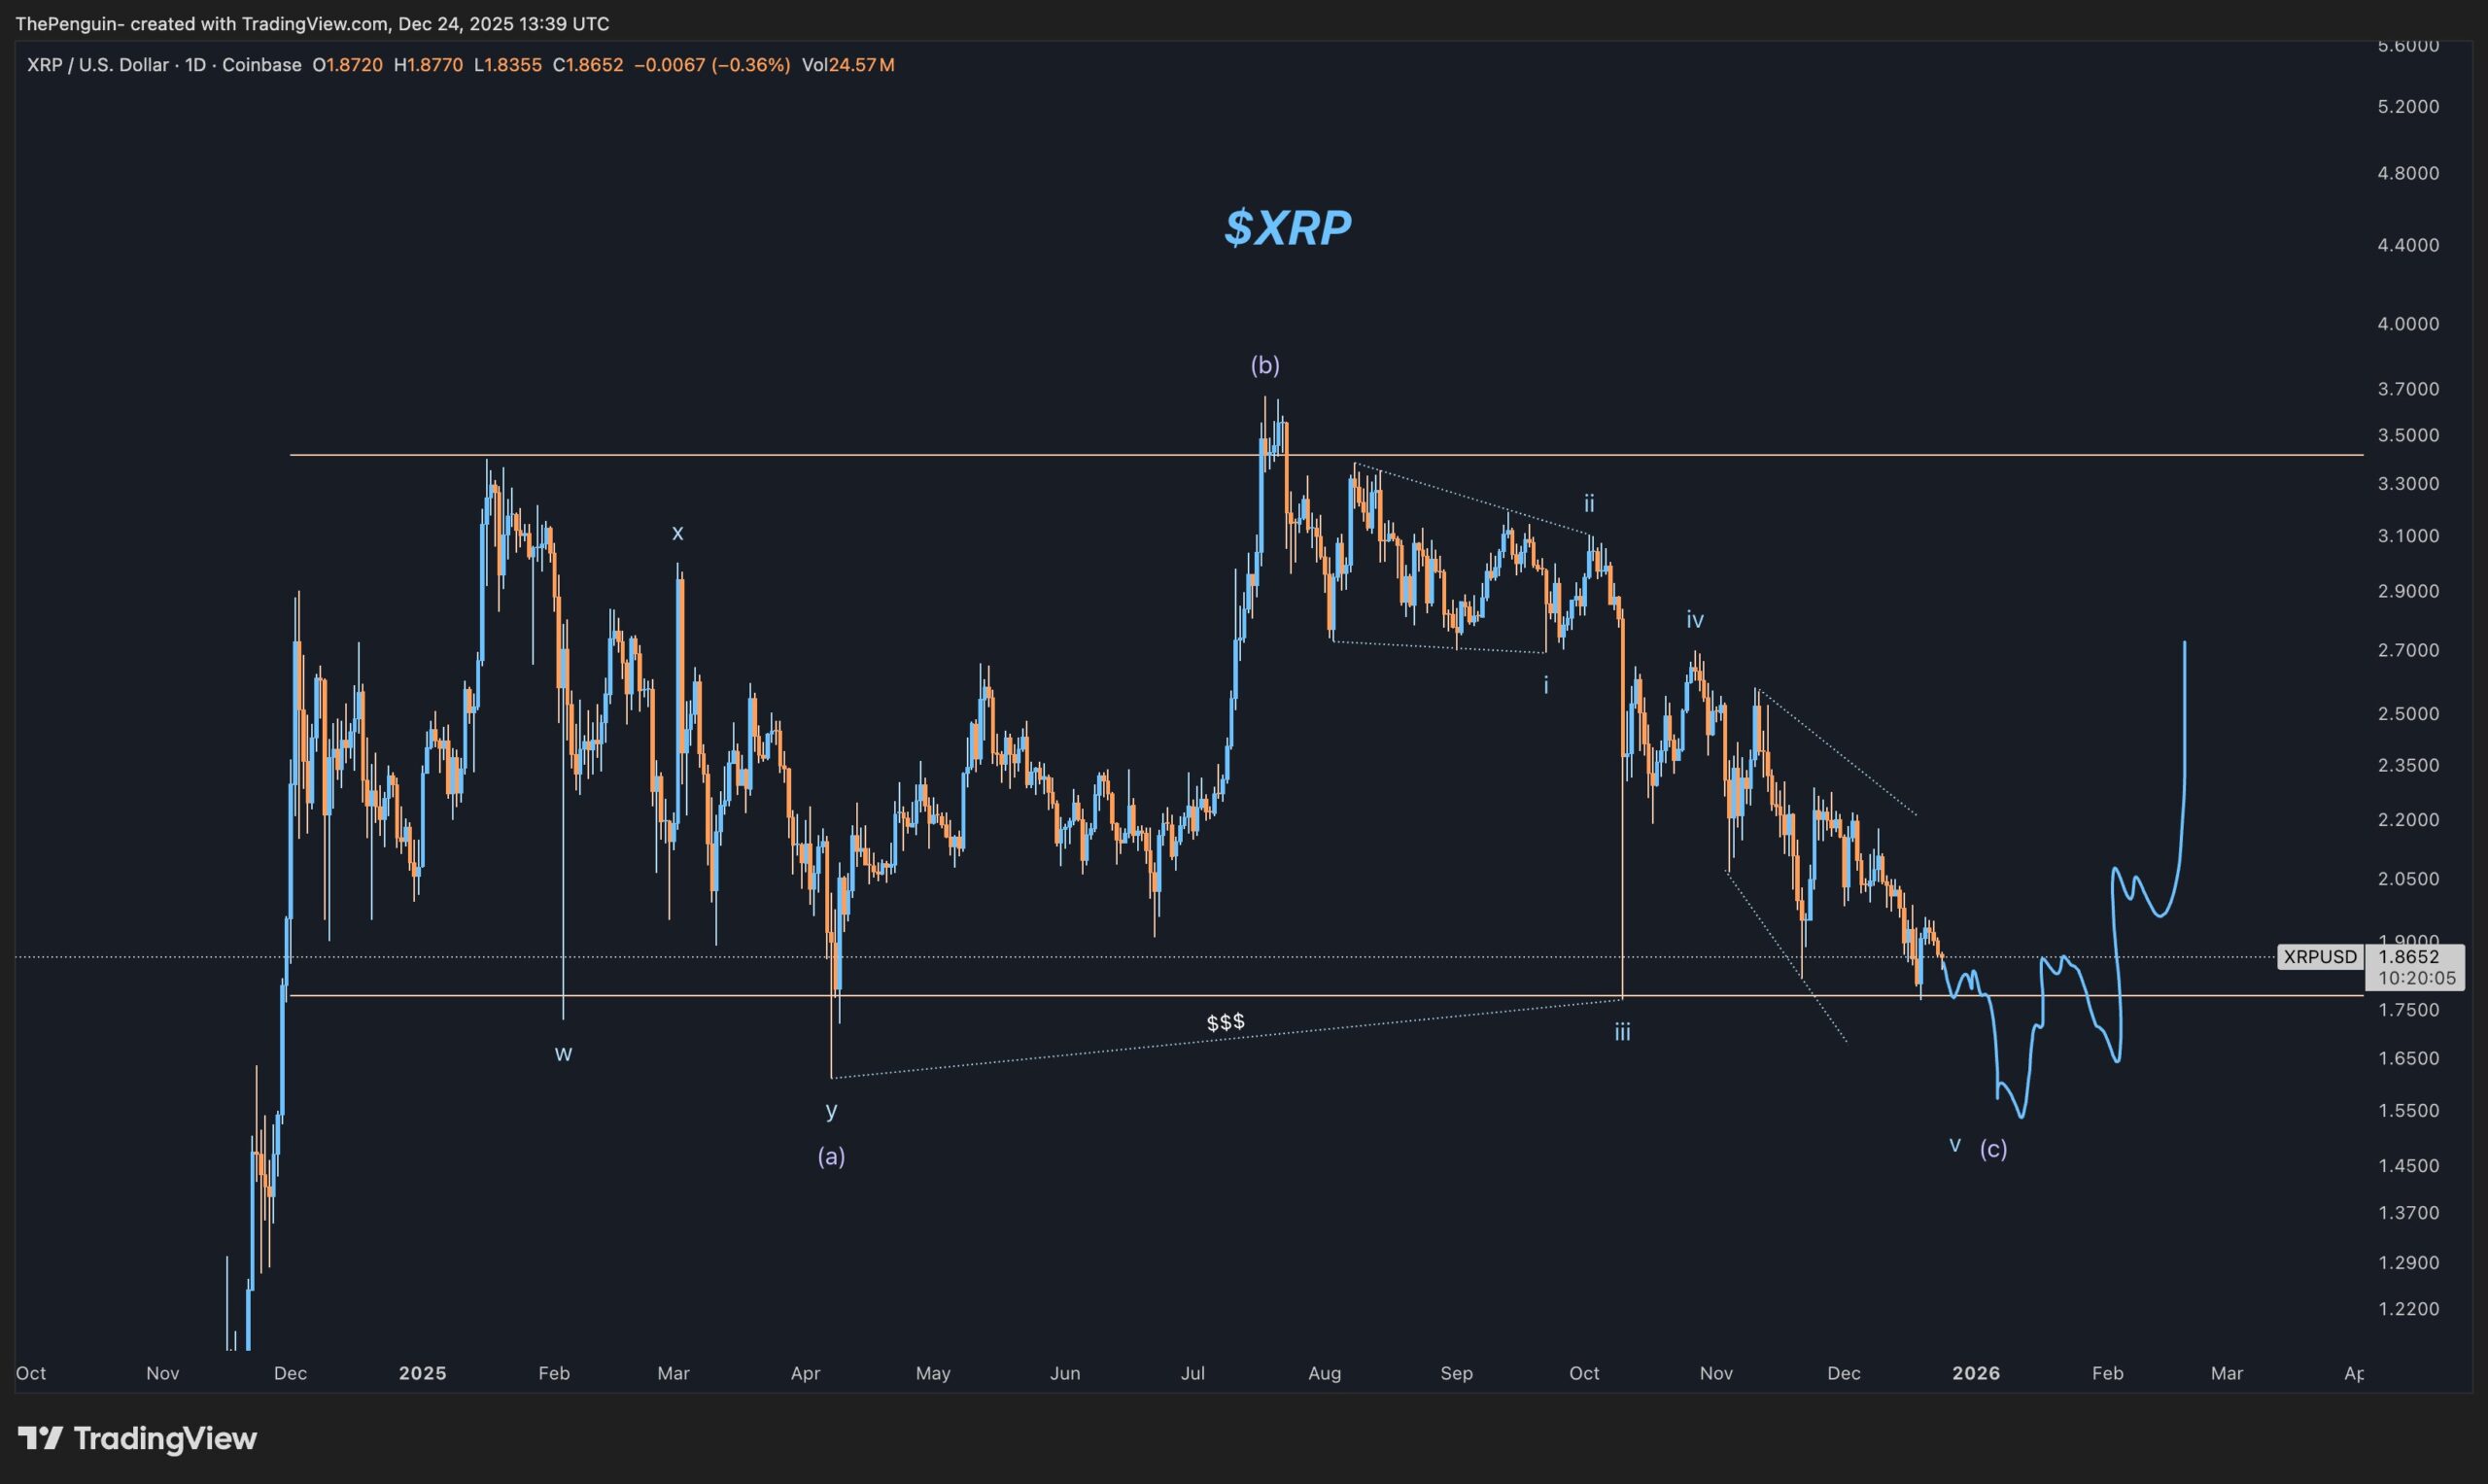
ThePenguinXBT said the “overall structure” still looked “mostly clean,” but added that the past month turned “tricky” because the final fifth wave overlapped.
In Elliott Wave terms, analysts often treat fifth wave overlap as a sign that a move may be ending or morphing into a different structure rather than continuing in a straight impulse.
ThePenguinXBT described the broader move as an expanded flat “pointing higher.”
An expanded flat is a corrective pattern where price typically makes three legs, and the middle leg pushes beyond the prior swing before the correction completes.
Traders watch it because it can finish with a final drop that looks like a breakdown, but it can also set up a reversal if price later reclaims key resistance.
The post also leaned toward an expanding diagonal for wave 5, which is a wedge like structure where waves overlap and the range can widen rather than tighten.
This type of diagonal can appear late in a trend, and it often signals unstable price action that can swing sharply in both directions before the structure resolves.
On the chart, dotted guide lines marked the decline into late December, while a projected path suggested a dip toward the mid $1.50s before a rebound.
ThePenguinXBT linked that idea to a possible double low liquidity sweep, which describes a move that briefly undercuts a prior low to trigger stops before price rebounds.
Still, the chart does not confirm that outcome yet, because XRP remained below the descending guide lines and had not printed a clear reversal break at the time of the snapshot.
Disclosure:This article does not contain investment advice or recommendations. Every investment and trading move involves risk, and readers should conduct their own research when making a decision.
Kriptoworld.com accepts no liability for any errors in the articles or for any financial loss resulting from incorrect information.

Tatevik Avetisyan is an editor at Kriptoworld who covers emerging crypto trends, blockchain innovation, and altcoin developments. She is passionate about breaking down complex stories for a global audience and making digital finance more accessible.
📅 Published: December 25, 2025 • 🕓 Last updated: December 25, 2025
