


Shiba Inu continued to grind lower inside a descending channel on the daily SHIB USDT chart, keeping the short term structure bearish. Meanwhile, price traded near 0.00000740 as sellers defended lower highs and kept candles capped under the channel’s upper boundary.
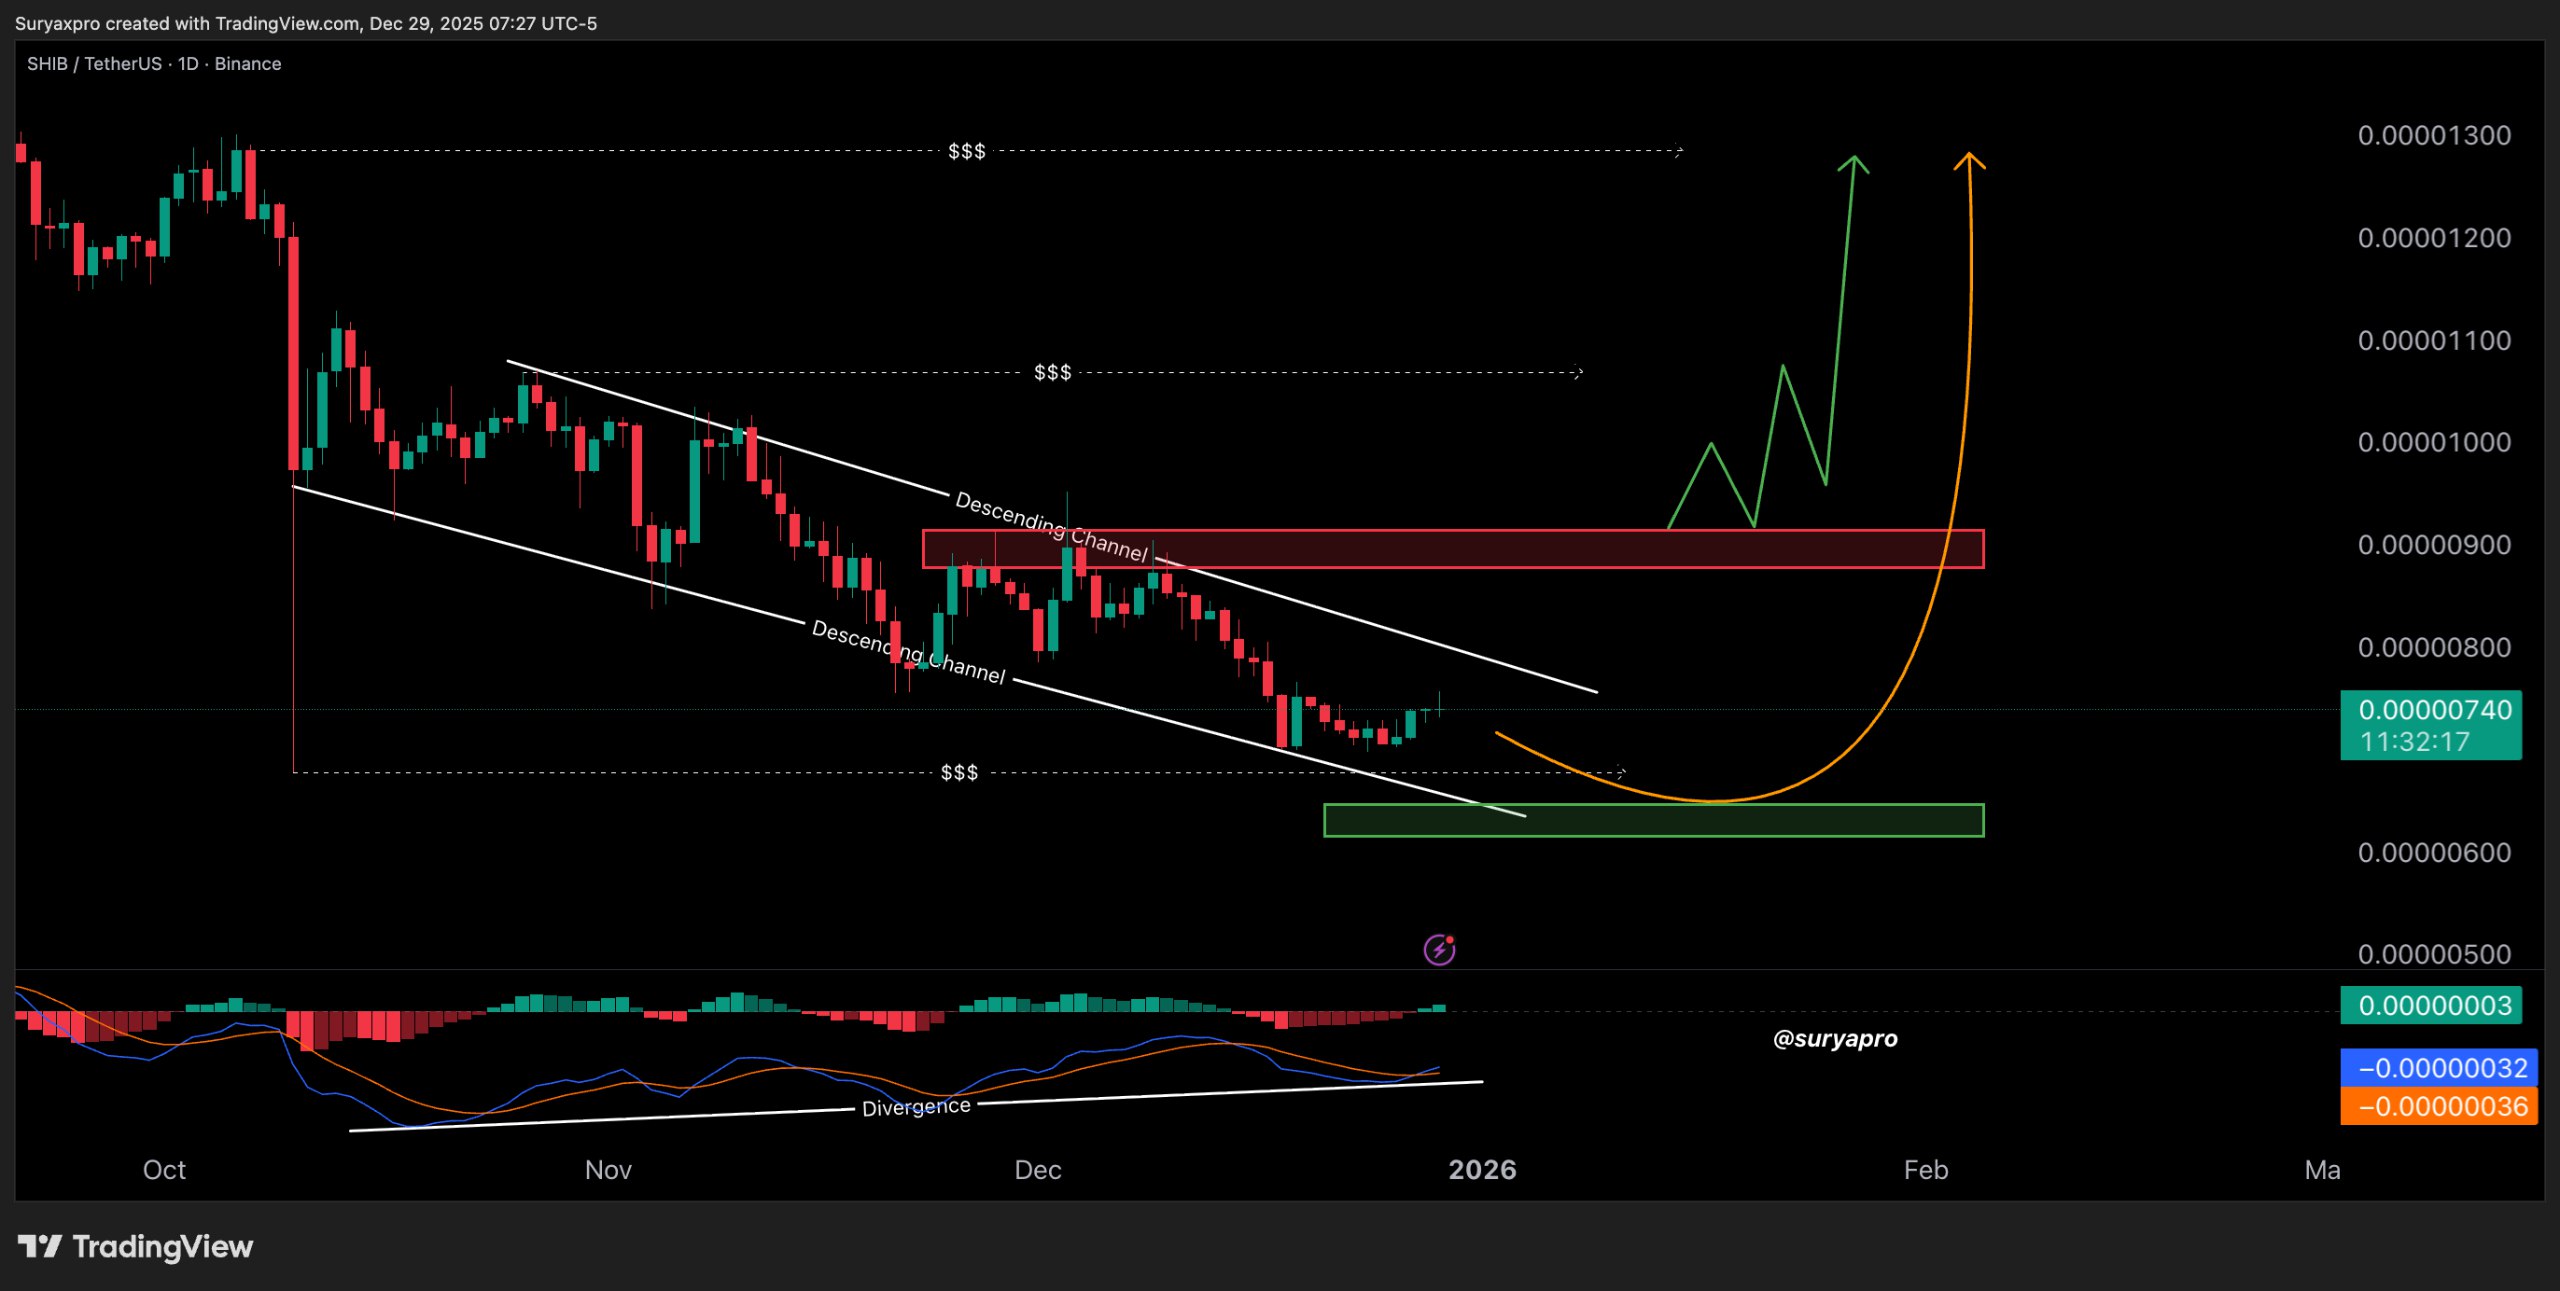
However, SHIB is now pressing into a demand area marked around 0.0000065 to 0.0000067, where reactions often decide whether a downtrend extends or pauses. At the same time, the momentum panel shows divergence, which signals that the selloff may be losing strength even as price drifts lower.
If buyers hold that demand zone and push price back above the channel, SHIB could attempt a recovery toward the first major supply band near 0.0000090. Still, the trend does not shift unless SHIB reclaims and holds above 0.0000090, because that level sits near the prior breakdown area and the channel’s mid to upper resistance.
If demand fails, then SHIB risks another leg down toward the next lower support area shown near the lower green box, as the descending channel remains intact. In addition, macro driven moves can override chart setups, so sudden volatility can invalidate these levels quickly.
SHIB chart highlights possible bottom zone as price holds near 0.006 area
Shiba Inu’s 4 day SHIB1000USDT perpetual chart on Bybit showed price sliding back into a long running support band, as a trader on X questioned whether the market is nearing an “actual bottom.” The chart’s latest candle closed near 0.007483 after printing a 0.006999 low, which kept SHIB pressed close to the green support line marked around 0.005900.
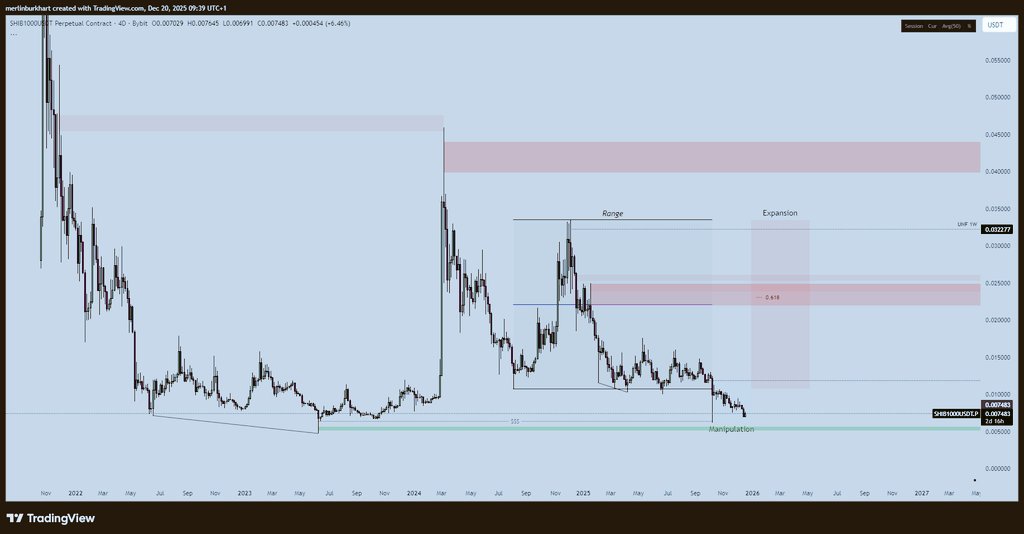
The setup shows a sharp 2024 spike followed by a long fade into 2025, with price now grinding at the base of the prior range. The author labeled the recent dip as “manipulation,” which frames the move as a sweep into liquidity near support rather than a clean trend reversal.
Overhead, the chart marks layered resistance zones, including a mid range band near the 0.618 level and a higher supply area above it. Because price remains below those bands, the broader structure stays capped, and any rebound would still need a sustained reclaim of prior range levels to shift the trend.
In the post, the trader said “heavy longs” are incoming and told followers to watch for a breakout. However, the chart itself only confirms location, not positioning, and the next directional clue will likely come from whether SHIB holds the 0.006 area or breaks beneath the marked 0.005900 line.
Disclosure:This article does not contain investment advice or recommendations. Every investment and trading move involves risk, and readers should conduct their own research when making a decision.
Kriptoworld.com accepts no liability for any errors in the articles or for any financial loss resulting from incorrect information.

Tatevik Avetisyan is an editor at Kriptoworld who covers emerging crypto trends, blockchain innovation, and altcoin developments. She is passionate about breaking down complex stories for a global audience and making digital finance more accessible.
📅 Published: December 30, 2025 • 🕓 Last updated: December 30, 2025
