


The TradingView chart (XRP USD, 1D, Bitstamp) was created on Dec 31, 2025, and it showed XRP trading near $1.87178 at the time of the snapshot, with the 50 day EMA around $2.05043 and RSI (14) near 41.92.
A falling wedge is a pattern where price makes lower highs and lower lows inside two downward sloping lines that move closer together, often signaling weakening selling pressure as the range tightens.
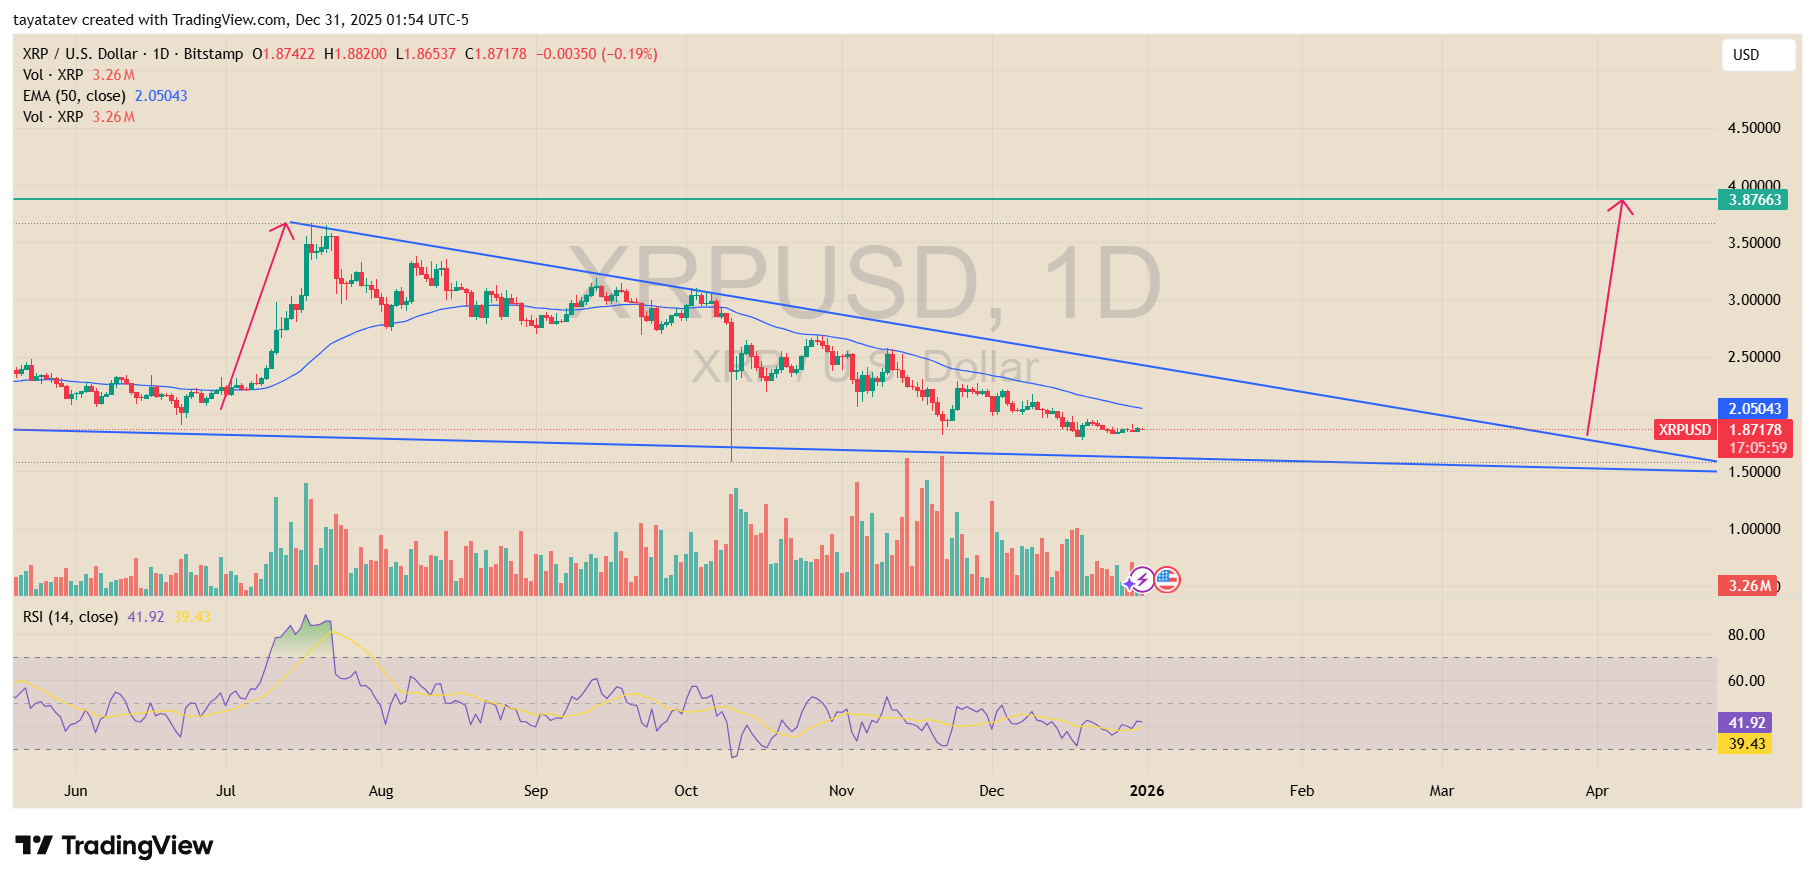
On this chart, the upper trendline slopes down from the July peak area, while the lower trendline also slopes down but flattens more, which forms the wedge and keeps XRP compressed near the lower boundary into late December.
Price stayed below the 50 day EMA, which kept the short term structure heavy, and the RSI under 50 also matched that softer momentum.
If the falling wedge confirms with a breakout above the upper wedge line, then a 106% move up from $1.87178 points to roughly $3.86 (about $3.8559), which lines up with the chart’s marked target zone around the high $3 area.
Stay ahead in the crypto world – follow us on X for the latest updates, insights, and trends!🚀
XRP monthly chart highlights long-term range expansion structure
The XRP USD 1-month chart shared on X shows a long-term structure where price moves through extended consolidation phases followed by sharp upside expansions.
The image was posted by the account @RippleXrpie and is labeled XRP USD, 1-Month, with historical price action displayed across multiple market cycles.
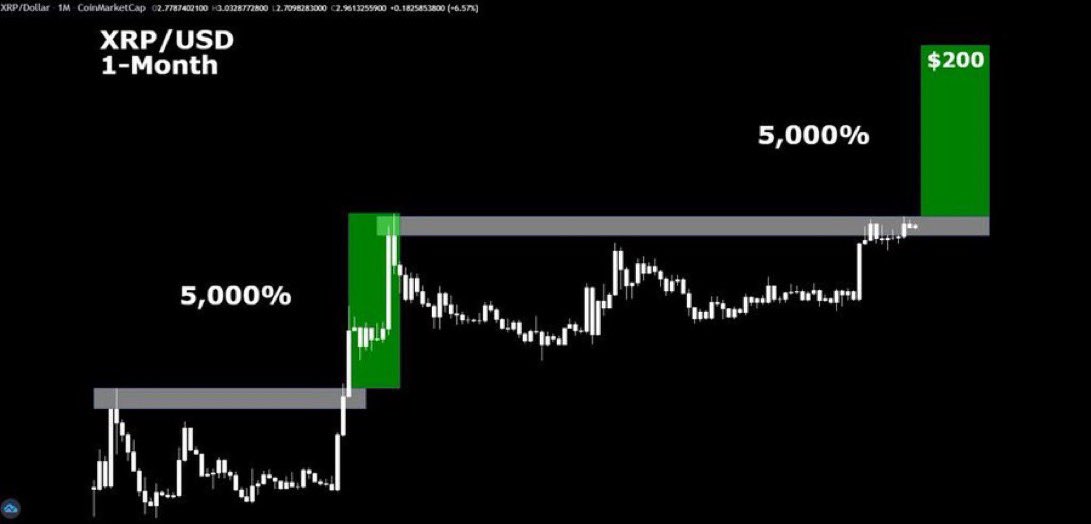
The chart marks two earlier breakout phases where XRP moved out of wide horizontal ranges and posted gains labeled near 5,000%.
In both cases, price spent long periods trading sideways below a clear resistance band before breaking above it and accelerating higher. After each expansion, XRP entered another prolonged consolidation phase at a higher level, forming a new base.
In the current structure, XRP is shown pressing into a similar horizontal resistance zone after months of range-bound movement.
Price action clusters tightly just below the marked resistance area, which mirrors earlier periods that preceded major upside moves on the same timeframe.
The visual comparison suggests repetition of past market behavior rather than short-term volatility.
The chart also projects a hypothetical upside extension toward higher price levels if the current resistance band is cleared on a monthly closing basis.
This projection reflects historical percentage moves shown on the chart and does not include timing or confirmation signals.
As shown, the focus remains on long-term structure and historical price behavior rather than near-term momentum.
Disclosure:This article does not contain investment advice or recommendations. Every investment and trading move involves risk, and readers should conduct their own research when making a decision.
Kriptoworld.com accepts no liability for any errors in the articles or for any financial loss resulting from incorrect information.
