


XRP traded around $1.875 on the daily XRPUSD Coinbase chart created Jan. 2, 2026, after weeks of tight, overlapping candles.
The range looks like consolidation, so the direction still reads unclear.
Stay ahead in the crypto world – follow us on X for the latest updates, insights, and trends!🚀
Price held above the recent base near $1.72, yet it did not reclaim the mid-range levels that previously acted as support.
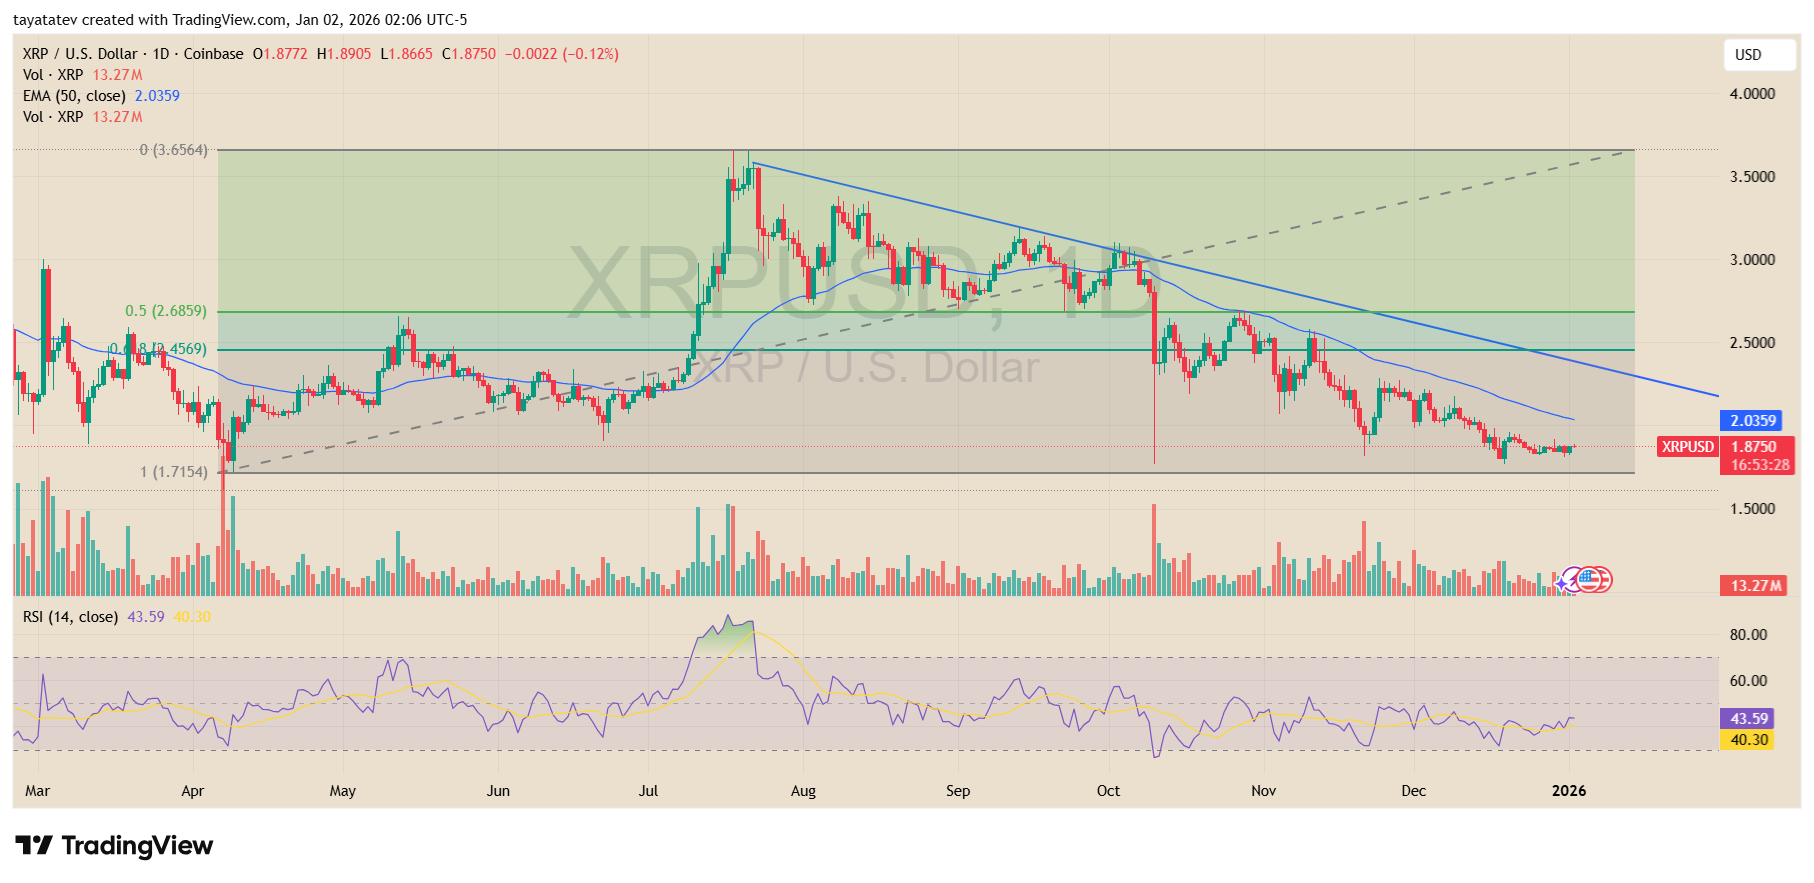
The chart shows a broader downtrend from the July peak, with a falling resistance line pressing lower across August through October.
XRP also stayed below the 50 day EMA, which sat near $2.036, so short term momentum remained capped. As long as price holds under that average, rebounds can fade into supply rather than extend into a clean trend leg.
A sharp drop in early October reset the structure and left XRP trading in a lower band into year end.
Since then, price kept making modest bounces, but each bounce rolled over quickly. That behavior supports the idea that the market is pausing and digesting losses, not reversing with strength.
Momentum signals also match the mixed setup. The RSI (14) read about 43.6, which sits below the neutral 50 line and points to weaker demand than earlier in the year.
At the same time, RSI stayed off extreme levels, which fits a consolidation phase where sellers lead but buyers still defend a floor.
For confirmation of a reversal, XRP needs to reclaim $2.50 and then hold above it. That level sits near a prior support zone and would also place price back above key mid-range resistance on the chart.
Until XRP breaks and holds $2.50 or higher, the structure still looks like consolidation inside a larger downtrend, with the next clear decision coming from either a reclaim of resistance or a breakdown below the $1.72 base.
Crypto Patel Flags $10 Talk as XRP Holds Below Long Term Resistance
Crypto Patel said on X that “$XRP Army is hoping for $10 ASAP,” while asking whether XRP hits $10 this bull run or sees a “first stop at $1.”
He shared a TradingView chart of XRP Tether USD on the 3 month timeframe from Poloniex, dated Jan. 1, 2026.
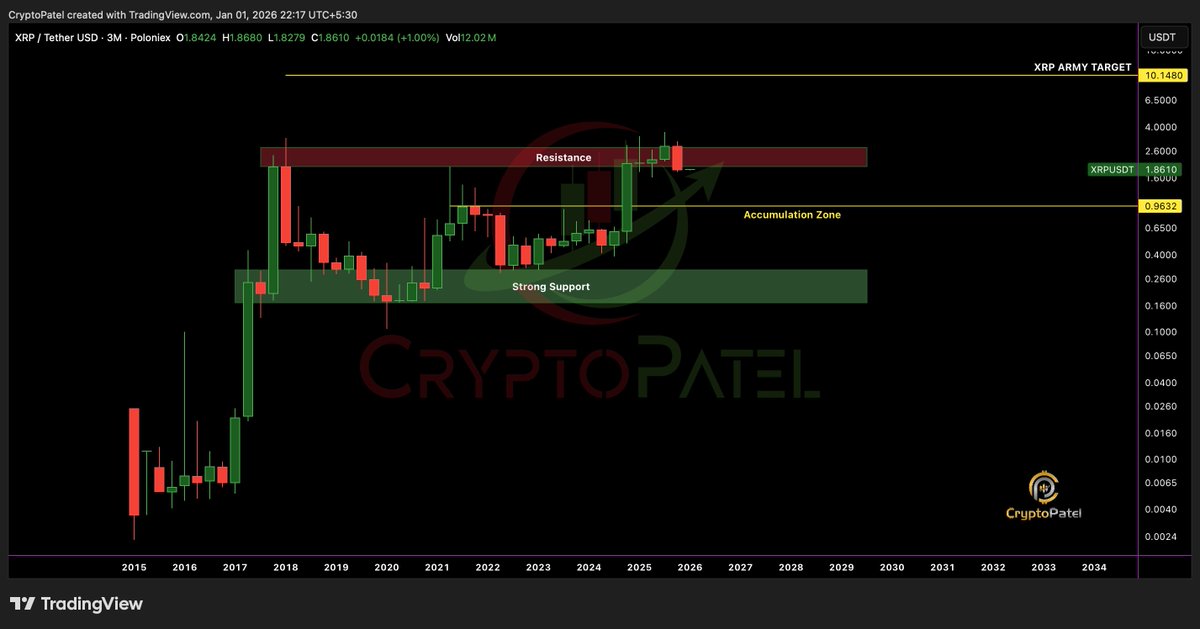
The chart showed XRPUSDT near $1.8610 at the snapshot. Price sat under a marked resistance band near the upper range, where prior candles stalled and rolled over.
The latest bars also showed a pullback from that zone, which keeps the market in a consolidation phase rather than a confirmed breakout.
Crypto Patel highlighted an “accumulation zone” around $0.9632 and a “strong support” band lower on the chart.
Those zones frame the downside areas traders may watch if price stays heavy under resistance.
Meanwhile, the chart also displayed an “XRP ARMY TARGET” near $10.1480, which sits far above current levels and remains a long term reference point rather than an active level on the current swing.
For a clearer reversal signal, XRP needs to reclaim the resistance band and then hold above it on the higher timeframe.
Until price closes above that area and sustains strength, the structure still reads as range bound, with direction not fully confirmed.
Disclosure:This article does not contain investment advice or recommendations. Every investment and trading move involves risk, and readers should conduct their own research when making a decision.
Kriptoworld.com accepts no liability for any errors in the articles or for any financial loss resulting from incorrect information.

Tatevik Avetisyan is an editor at Kriptoworld who covers emerging crypto trends, blockchain innovation, and altcoin developments. She is passionate about breaking down complex stories for a global audience and making digital finance more accessible.
📅 Published: January 2, 2026 • 🕓 Last updated: January 2, 2026
