


Ethereum remains locked inside a long running range, with price action continuing to respect clearly defined levels on the higher time frame.
On the three day Coinbase chart shared by Daan Crypto Trades, ETH rejected again near the $2,800 area after failing to reclaim the former support band around $2,850 to $2,815.
Stay ahead in the crypto world – follow us on X for the latest updates, insights, and trends!🚀
As a result, price rolled over and moved back toward the middle of the range.
This repeated behavior shows that upside attempts keep losing strength near the same zone, which has capped several rebounds since late 2024.
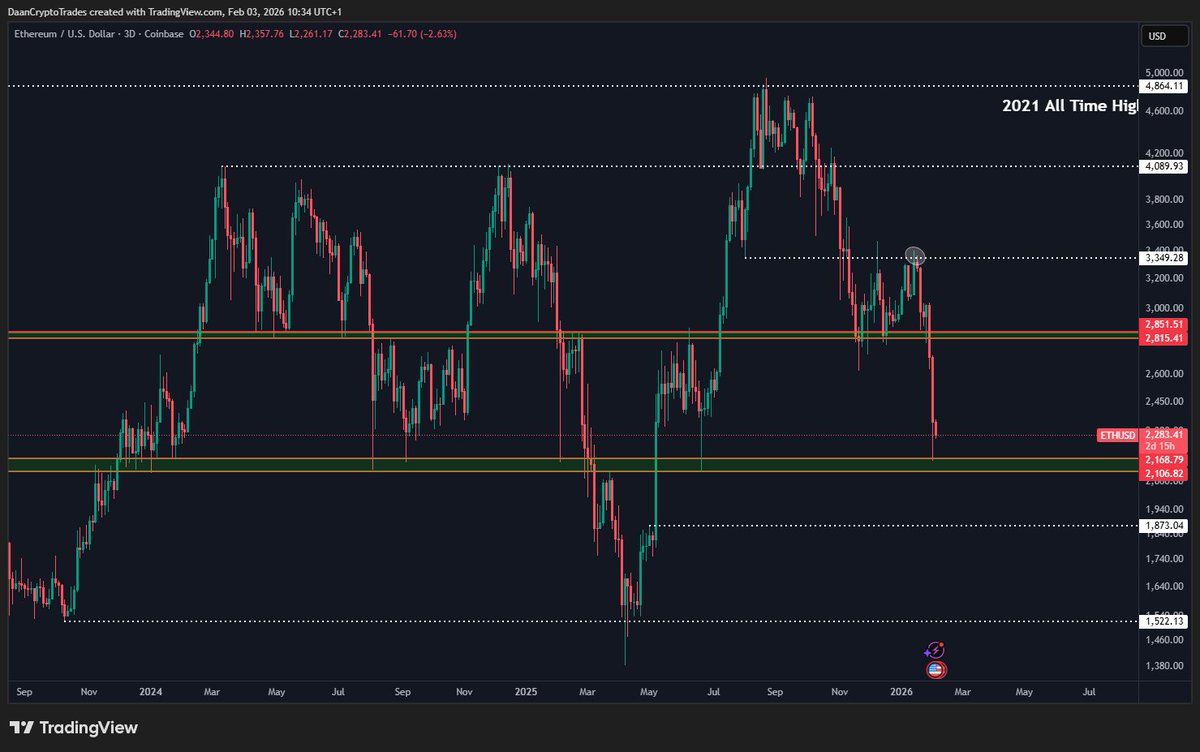
At the same time, the $2,100 area continues to act as a major floor for price.
Each time ETH trades into this zone, selling pressure slows and price stabilizes. As a result, this level has defined the lower boundary of the broader structure.
The chart shows several sharp reactions from this area over the past year, which confirms its role as a key reference point for market participants.
Therefore, price action between $2,100 and $2,800 reflects balance rather than trend, with neither side gaining lasting control.
The structure also shows how former breakout levels continue to shape current trading behavior. The $1,800 region, marked as the prior breakout area before the large rally tied to the Tom Lee and BitMine driven move, sits below the current range.
Earlier in the cycle, price accelerated once it cleared that zone. Now, that same area stands out as a historical pivot, since it marked the transition from consolidation into expansion.
This context explains why the chart highlights $1,800 as a key reference below the current range.
Across the cycle, Ethereum’s broader structure has remained uneven, with sharp rallies followed by fast reversals.
Each push toward higher levels failed to hold above resistance, while declines repeatedly slowed near the same support zones.
As a result, the market continues to trade inside a well defined band rather than establishing a sustained directional move.
This repeated respect of clean levels has kept price behavior structured, even as momentum faded during each attempt to extend beyond the range.
Ethereum Holds Macro Channel Support as Price Returns to Prior Extension Area
Meanwhile, Ethereum pulled back into the $2,500 area on the weekly Coinbase chart, placing price on immediate degree support that also aligns with the 0.618 Fibonacci retracement.
At the same time, ETH touched the lower boundary of the long term rising channel that has guided price since the 2020 cycle low.
As a result, this zone now concentrates several key technical references, which explains why price reacted again at this level.
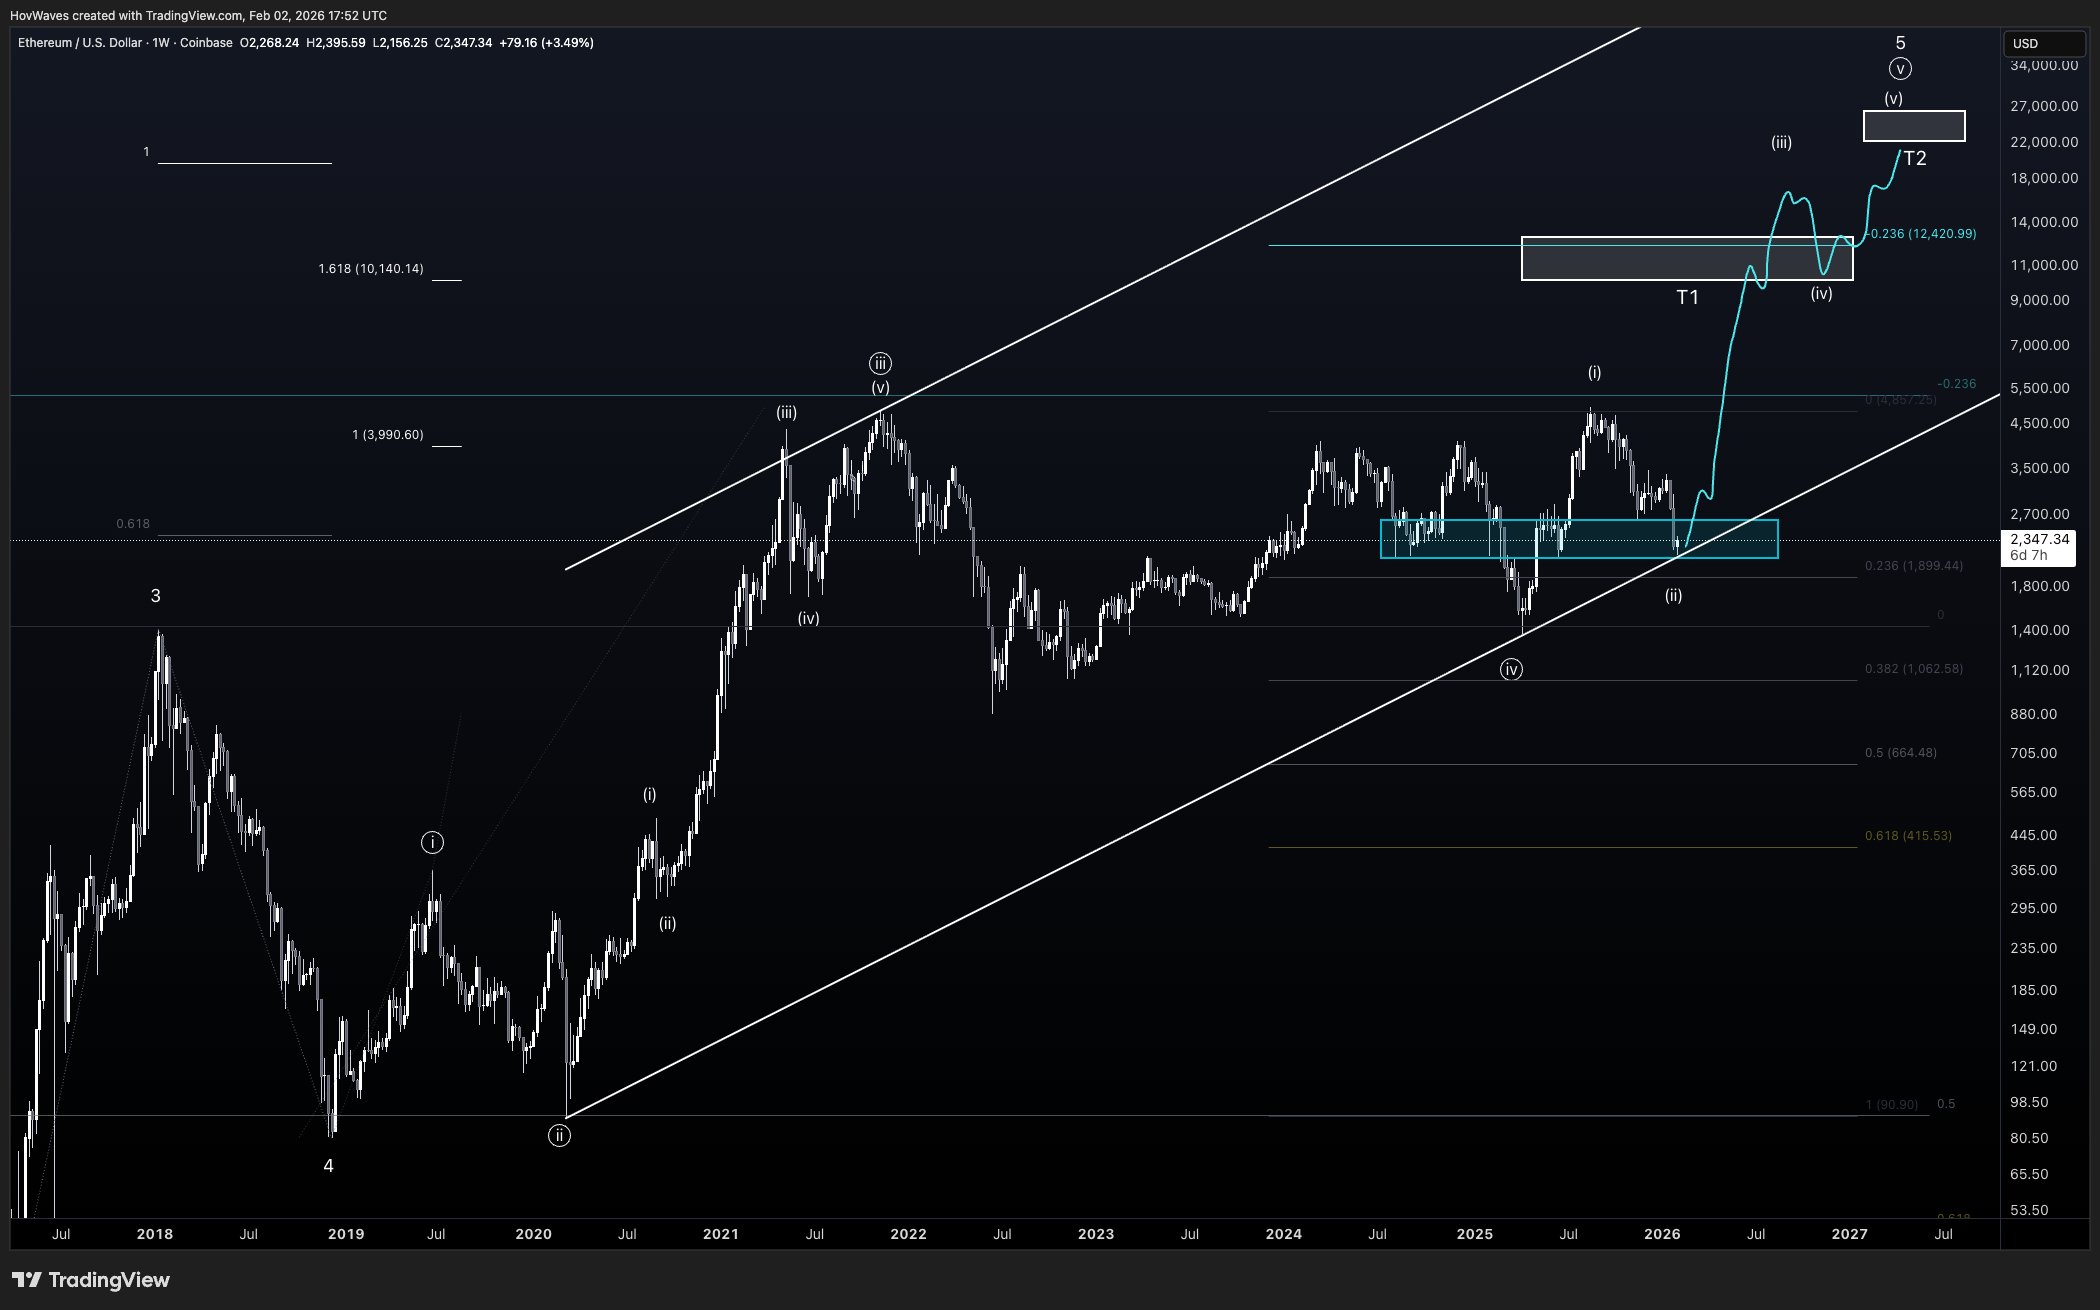
Earlier in the cycle, Ethereum pushed into new highs through what the chart labels as an extended fifth wave.
That move stretched beyond the channel before reversing. The current decline brought price back to the point where that extension began, which matches the structure shown on the chart.
Therefore, ETH has shifted from a stretched position back into the core of the long term channel that framed prior trend phases.
The weekly structure shows Ethereum trending inside a rising channel across multiple cycles, with wave counts marking impulsive and corrective phases.
After the 2021 peak, price corrected for an extended period before resuming higher. More recently, ETH rebounded from the lower channel area but stalled below prior highs, which reflects weak follow through on rallies.
Across this cycle, advances have faded quickly, while pullbacks have returned price to key structural zones.
Each reset toward channel support and major retracement levels has contained downside without establishing sustained upside momentum.
This pattern keeps Ethereum trading within the same long running framework.
Disclosure:This article does not contain investment advice or recommendations. Every investment and trading move involves risk, and readers should conduct their own research when making a decision.
Kriptoworld.com accepts no liability for any errors in the articles or for any financial loss resulting from incorrect information.

Tatevik Avetisyan is an editor at Kriptoworld who covers emerging crypto trends, blockchain innovation, and altcoin developments. She is passionate about breaking down complex stories for a global audience and making digital finance more accessible.
📅 Published: February 4, 2026 • 🕓 Last updated: February 4, 2026
