


A trader posting as The Penguin told followers on X that he expects to turn bullish on Solana after previously holding a bearish view near the cycle top.
He framed the shift as a contrarian approach, saying he fades crowd sentiment and looks to get bullish when the broader mood turns negative.
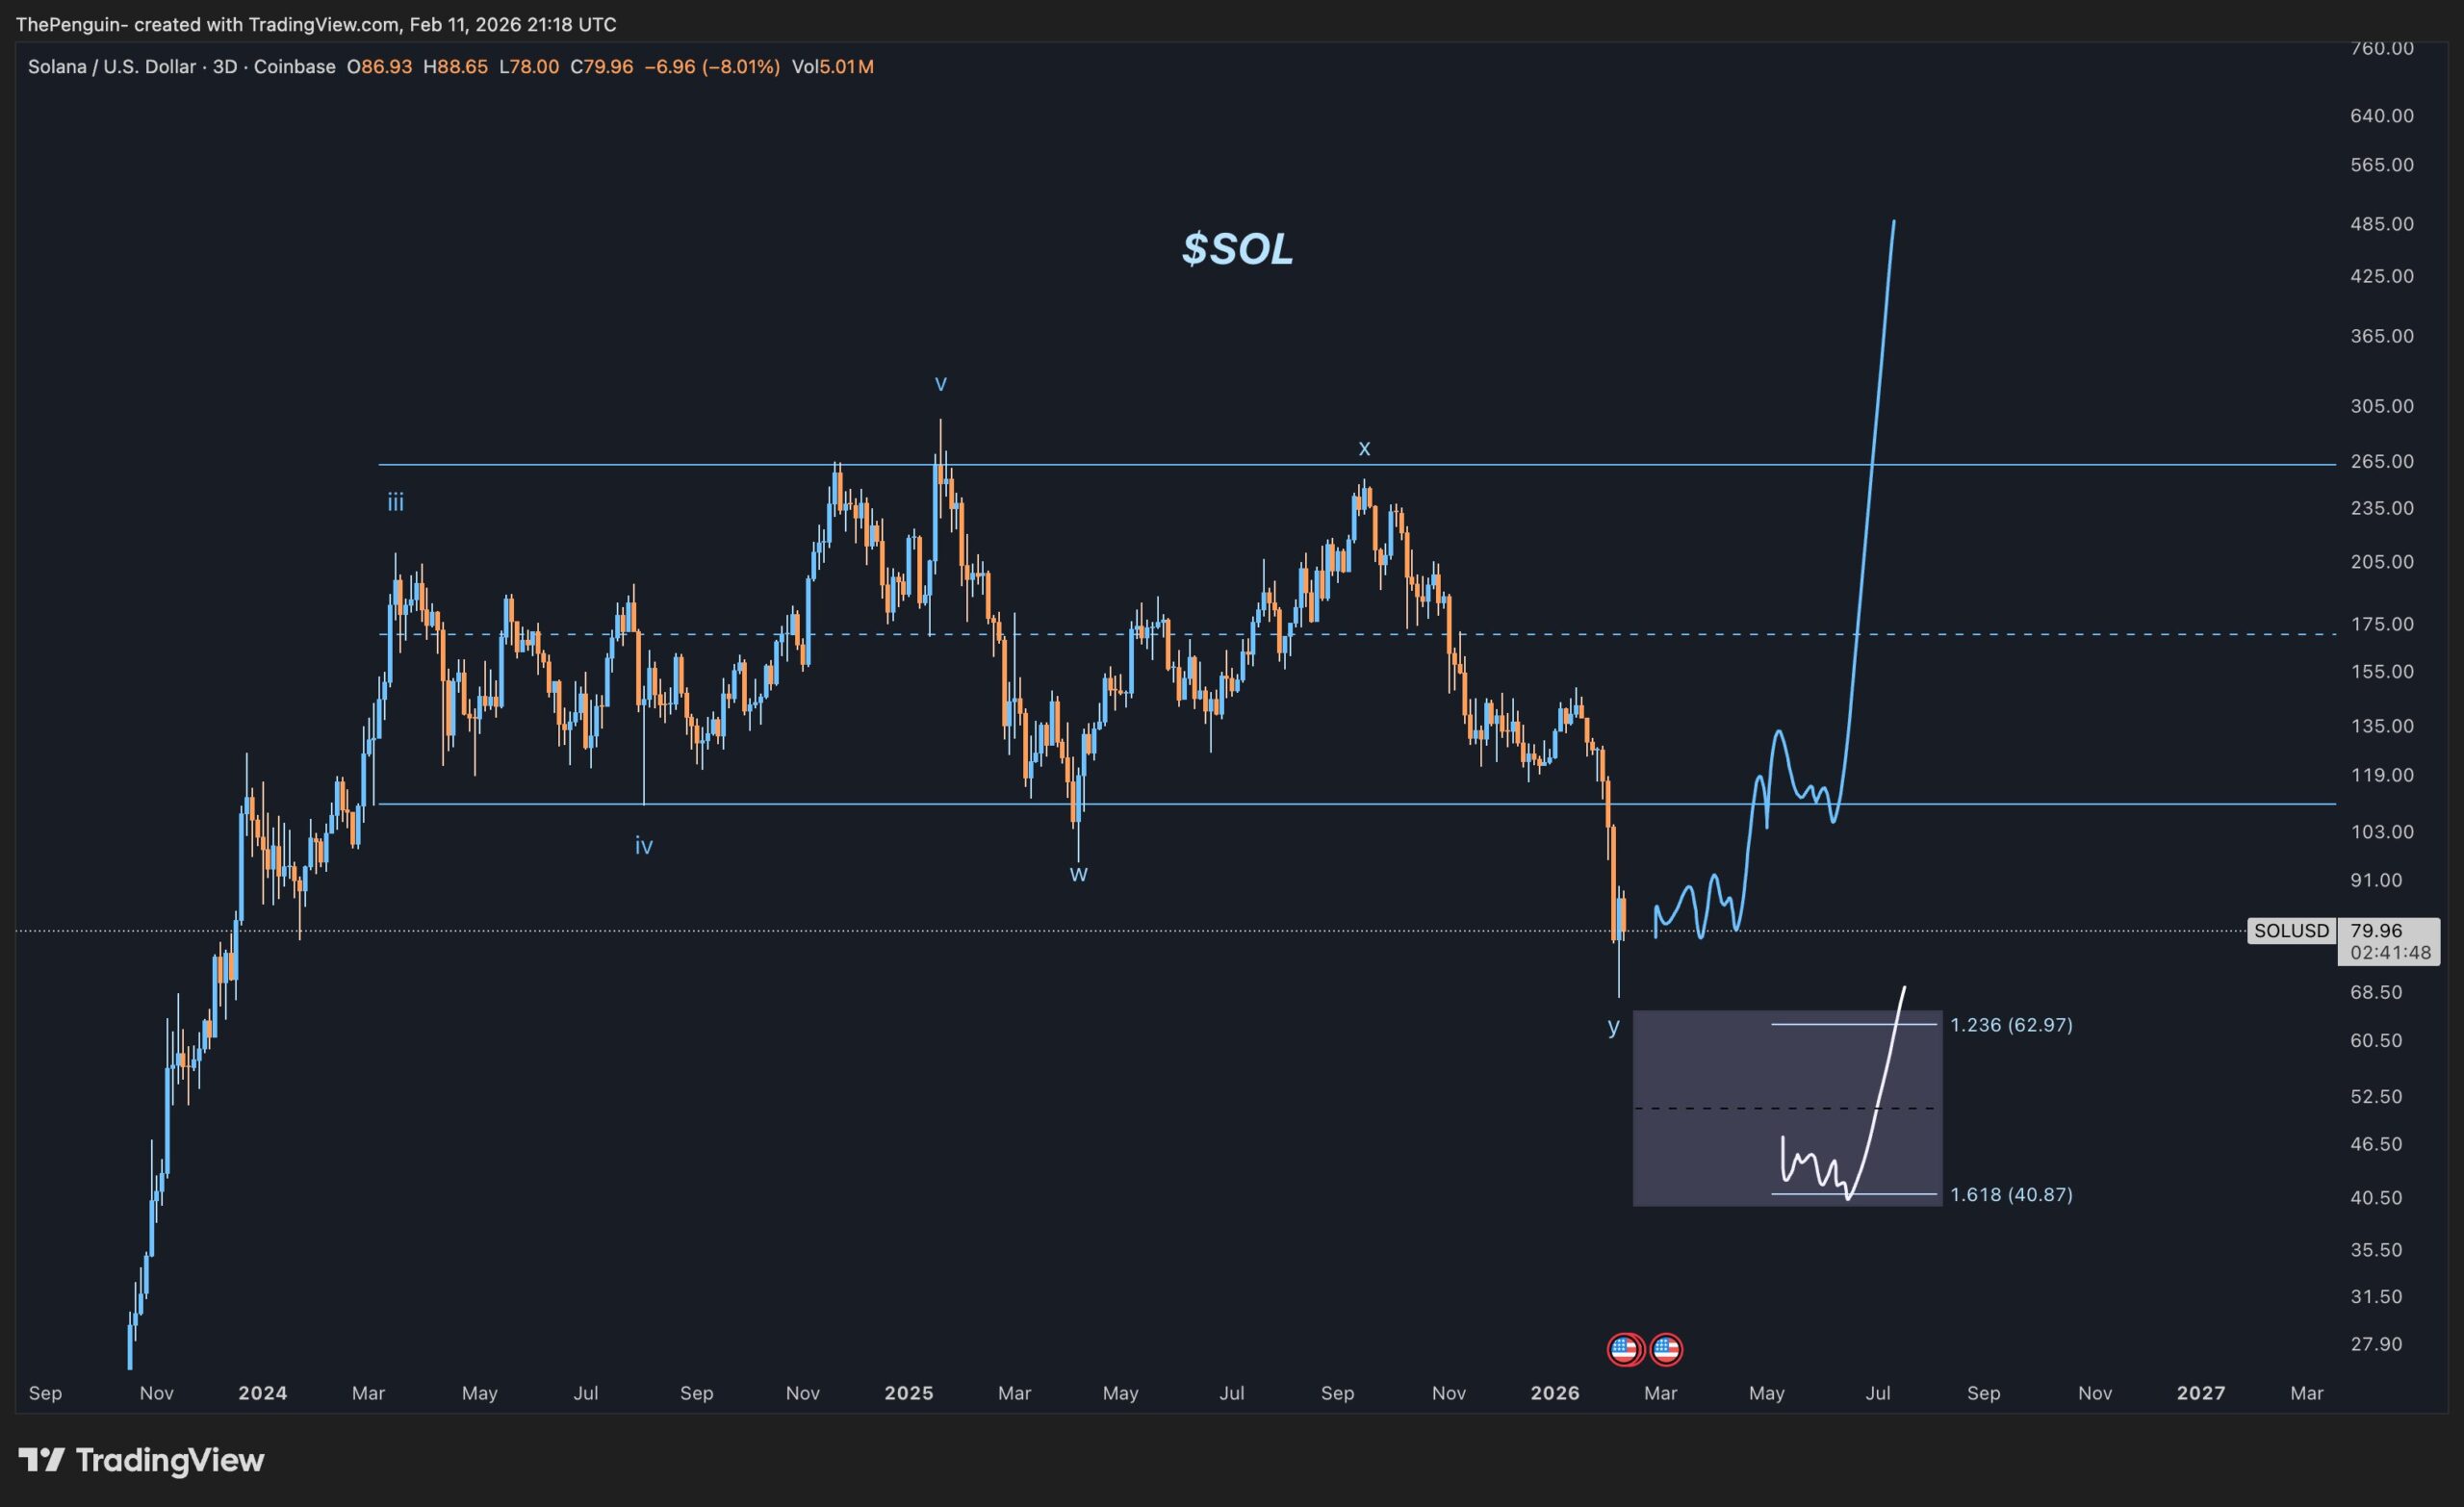
The post accompanied a TradingView chart of Solana against the U.S. dollar on Coinbase using a three day timeframe, timestamped Feb. 11, 2026.
The chart showed SOL near $79.96 after a steep slide, with the session marked by a low near $78.00 and an 8% drop on the day alongside about 5.01 million in volume.
On the chart, price action from 2024 through early 2026 sits inside a wide range, with horizontal levels drawn near about $119 and $265 and a dashed reference line near $175.
After the latest breakdown, SOL fell through the lower band and then stabilized around the high $70s, where the chart places the current price tag.
The same snapshot also sketched a forward path that starts with choppy consolidation near current levels, then a move back toward the low $100s before a sharp rally projection later in 2026.
An inset box highlighted potential downside markers using extension labels near $62.97 and $40.87, while the broader drawing suggested the trader views the recent drop as part of a setup rather than a final trend call.
Trader says Solana “bottom is in” as chart projects move toward $401
An X user posting as DonWedge said Solana has likely set a bottom and is preparing for another rally, pointing to a TradingView chart that sketches a rebound path after a steep downtrend.
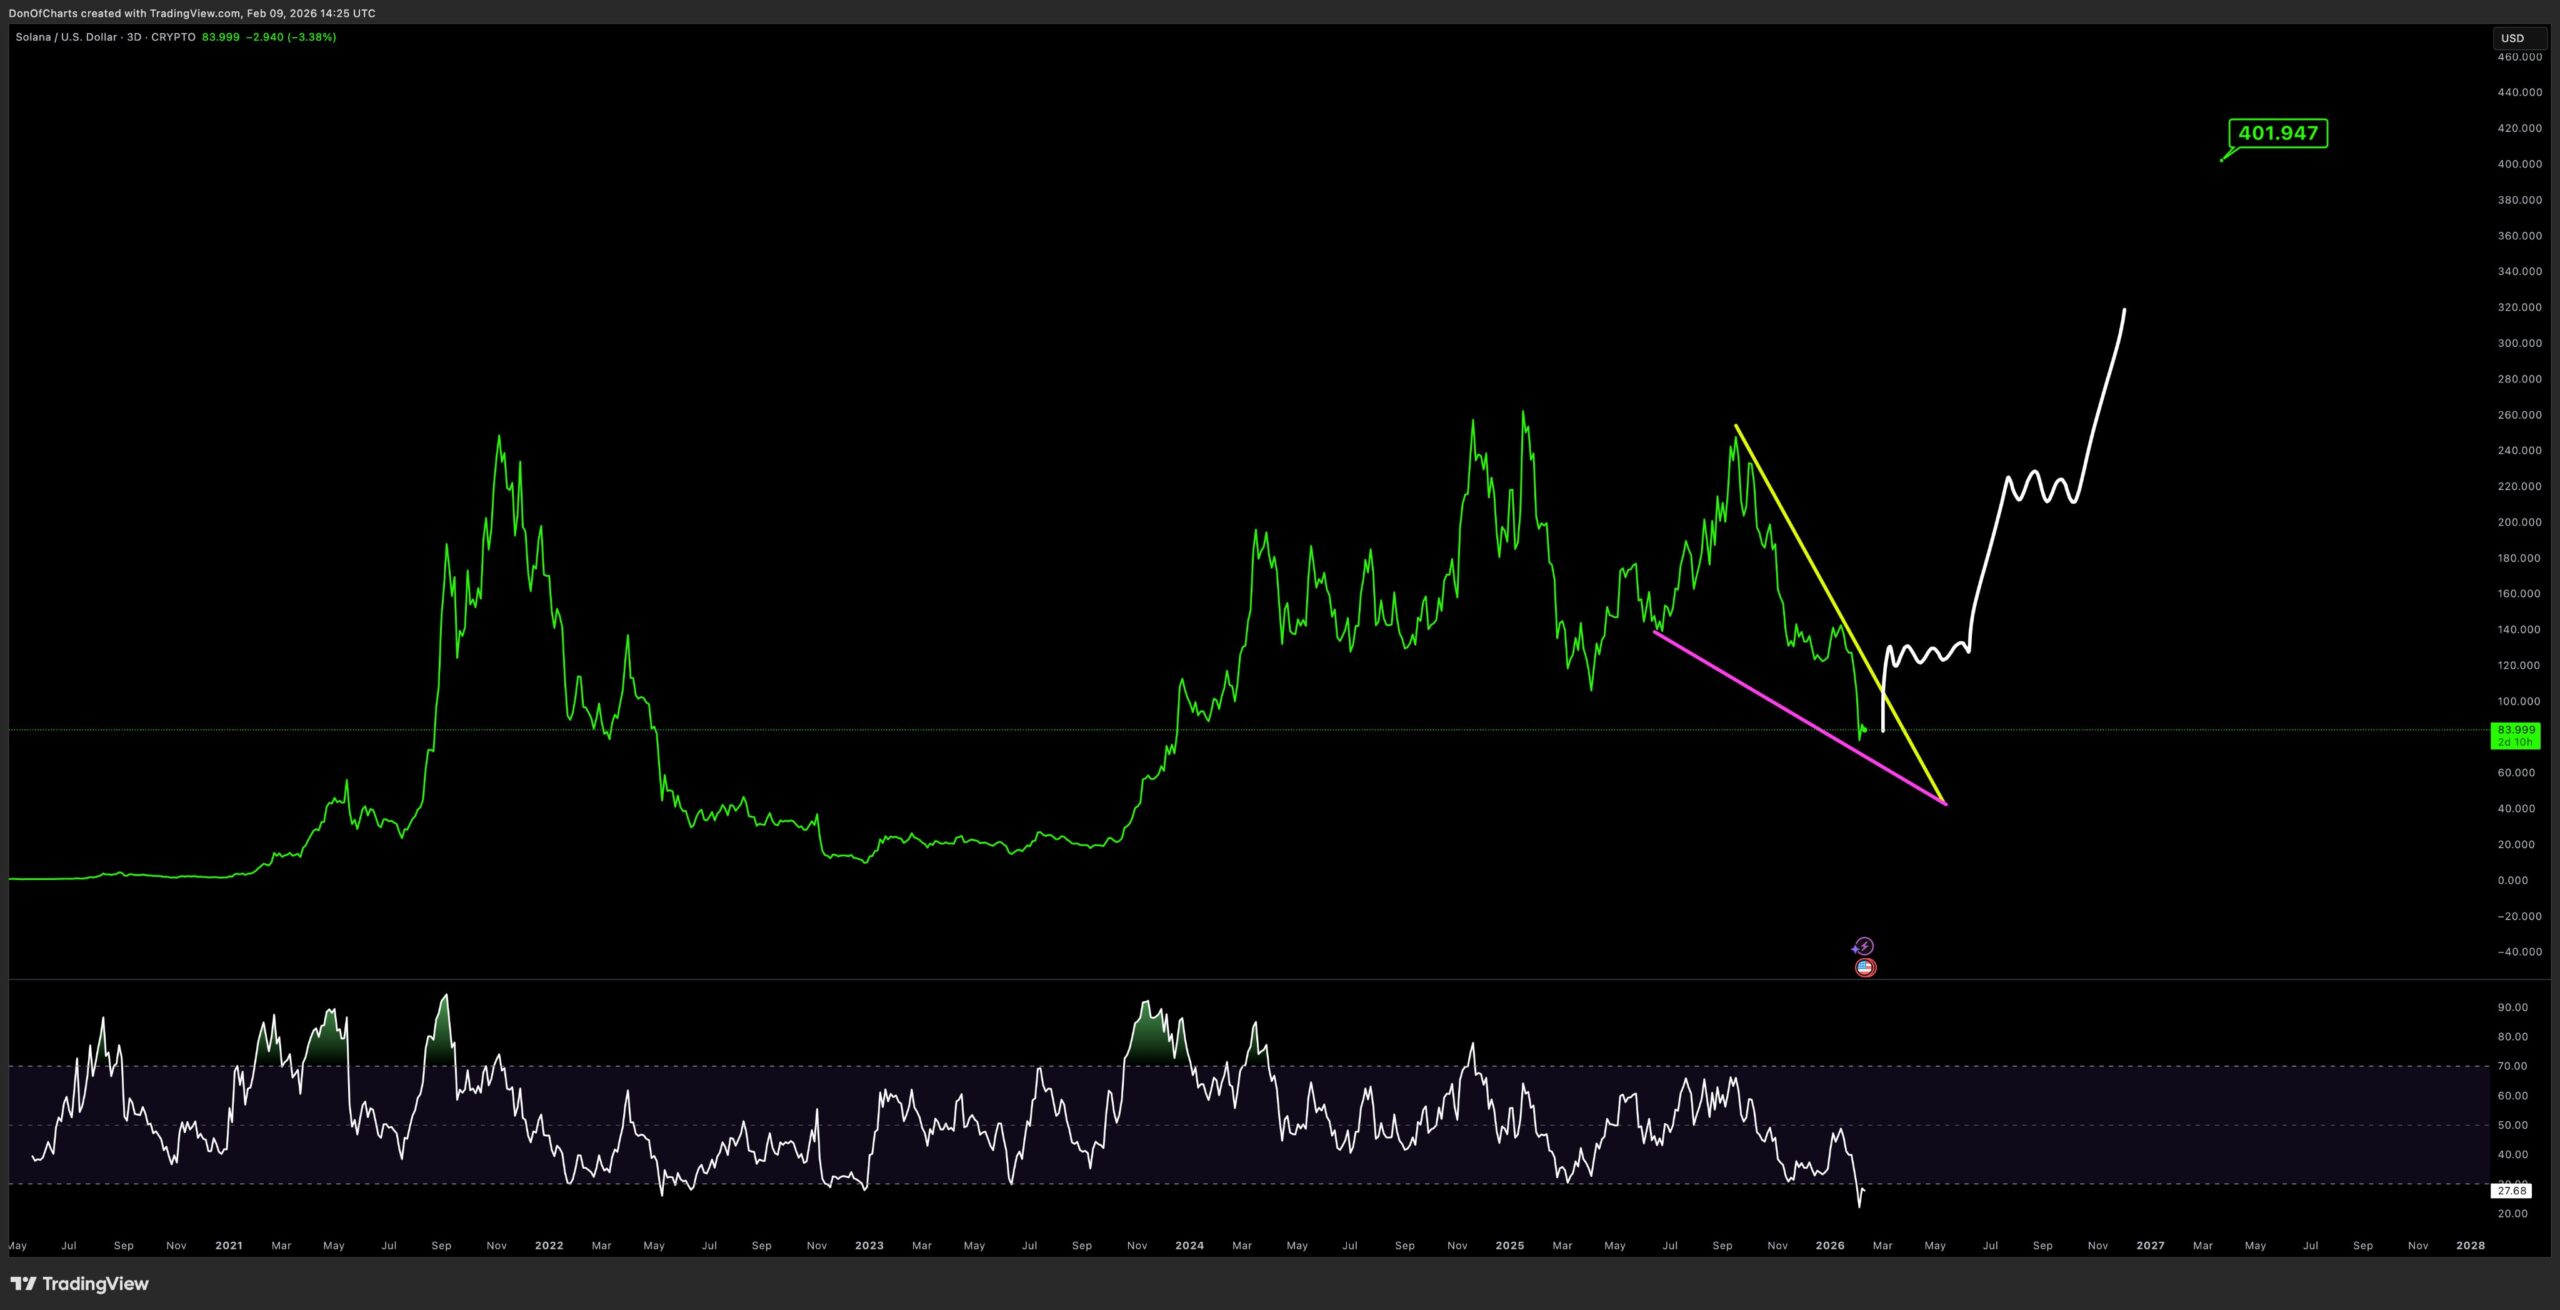
In the post, the trader wrote that “the bottom is in for $SOL” and said the token is “gearing up for its next leg up.”
The shared chart tracked SOL/USD on a 3 day timeframe and showed price near $83.99 at the time of the snapshot.
The chart marked a recent decline with two sloping trendlines, then drew a white, step like projection that turns higher after the drop.
That projected path climbed through the $100 area, then continued upward in waves, with a highlighted label near $401.947 placed as a distant upside reference.
A lower panel displayed RSI, which sat near 27.68 on the image, placing momentum near the oversold zone as price traded close to the low $80s.
Disclosure:This article does not contain investment advice or recommendations. Every investment and trading move involves risk, and readers should conduct their own research when making a decision.
Kriptoworld.com accepts no liability for any errors in the articles or for any financial loss resulting from incorrect information.

Tatevik Avetisyan is an editor at Kriptoworld who covers emerging crypto trends, blockchain innovation, and altcoin developments. She is passionate about breaking down complex stories for a global audience and making digital finance more accessible.
📅 Published: February 12, 2026 • 🕓 Last updated: February 12, 2026
