


Solana hit a widely watched downside target on an intraday chart, but the next move will decide whether the drop ends or extends.
Solana taps 100 percent extension as traders watch $76.50 invalidation
SOLUSD on Binance’s 30 minute chart pushed into the analyst’s marked “100% extension” area, a level often used to gauge whether a move has reached a measured objective.
Stay ahead in the crypto world – follow us on X for the latest updates, insights, and trends!🚀
The chart showed SOL near $81.05 after the decline, with the 61.8% marker labeled around $81.80 sitting just overhead as the nearest retracement reference.
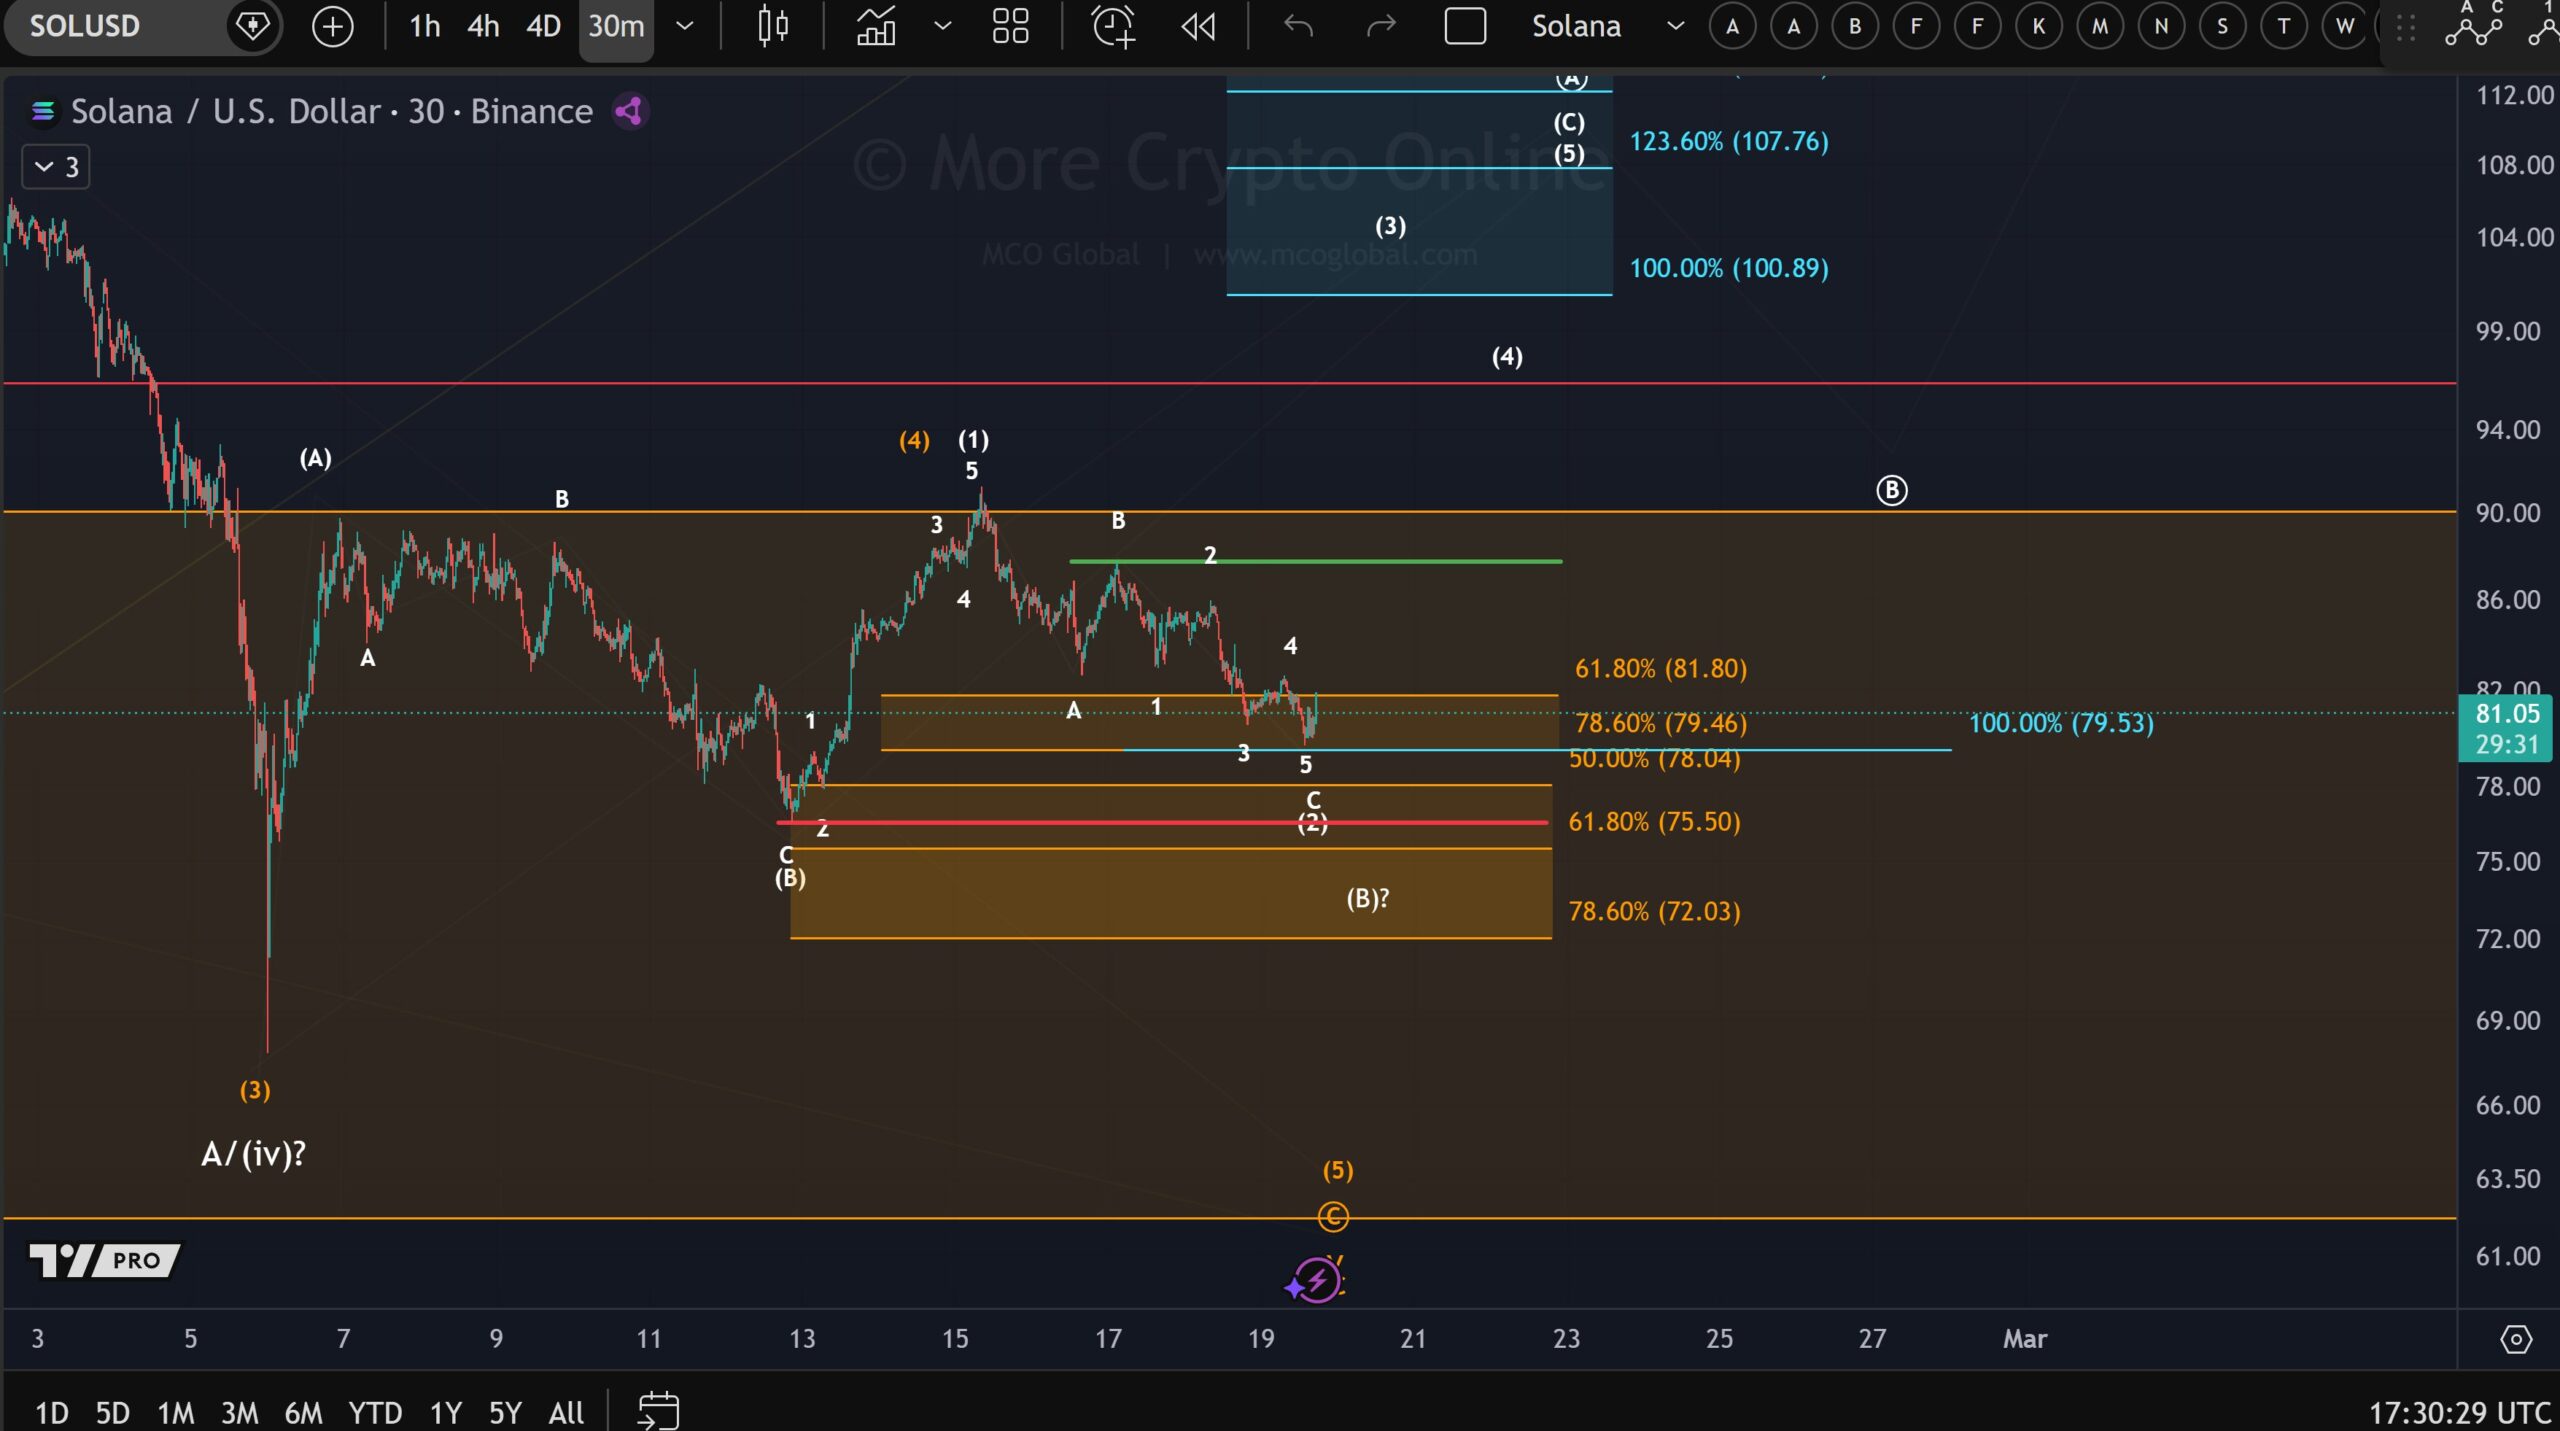
However, the analyst framed the extension tag as a decision point, not a confirmed bottom.
In that view, price needs follow through evidence such as a higher low, a clean break back above nearby resistance, or a stronger rebound structure before calling the extension area a durable low.
On the same chart, the tight support cluster sat around $79.53 to $79.46, where the extension line and a 78.6% retracement level overlapped.
Below that, the next downside levels appeared near $78.04, then $75.50, with a deeper band mapped toward roughly $72.03.
The post also set a clear failure level for the bullish “1 to 2” setup. It placed the invalidation point at $76.50, meaning a drop through that level would break the structure the analyst uses for a potential upside continuation and shift focus back to lower supports.
Solana holds range under falling SMAs as accumulation case forms
SOLUSD on Coinbase’s four hour chart traded near $83 after a steep slide from late January highs, then moved into a boxed range between roughly $76 and $92.
The structure showed repeated bounces from the lower edge of the range, while rallies stalled near the upper boundary.
As a result, price shifted from one directional selling to sideways trade.
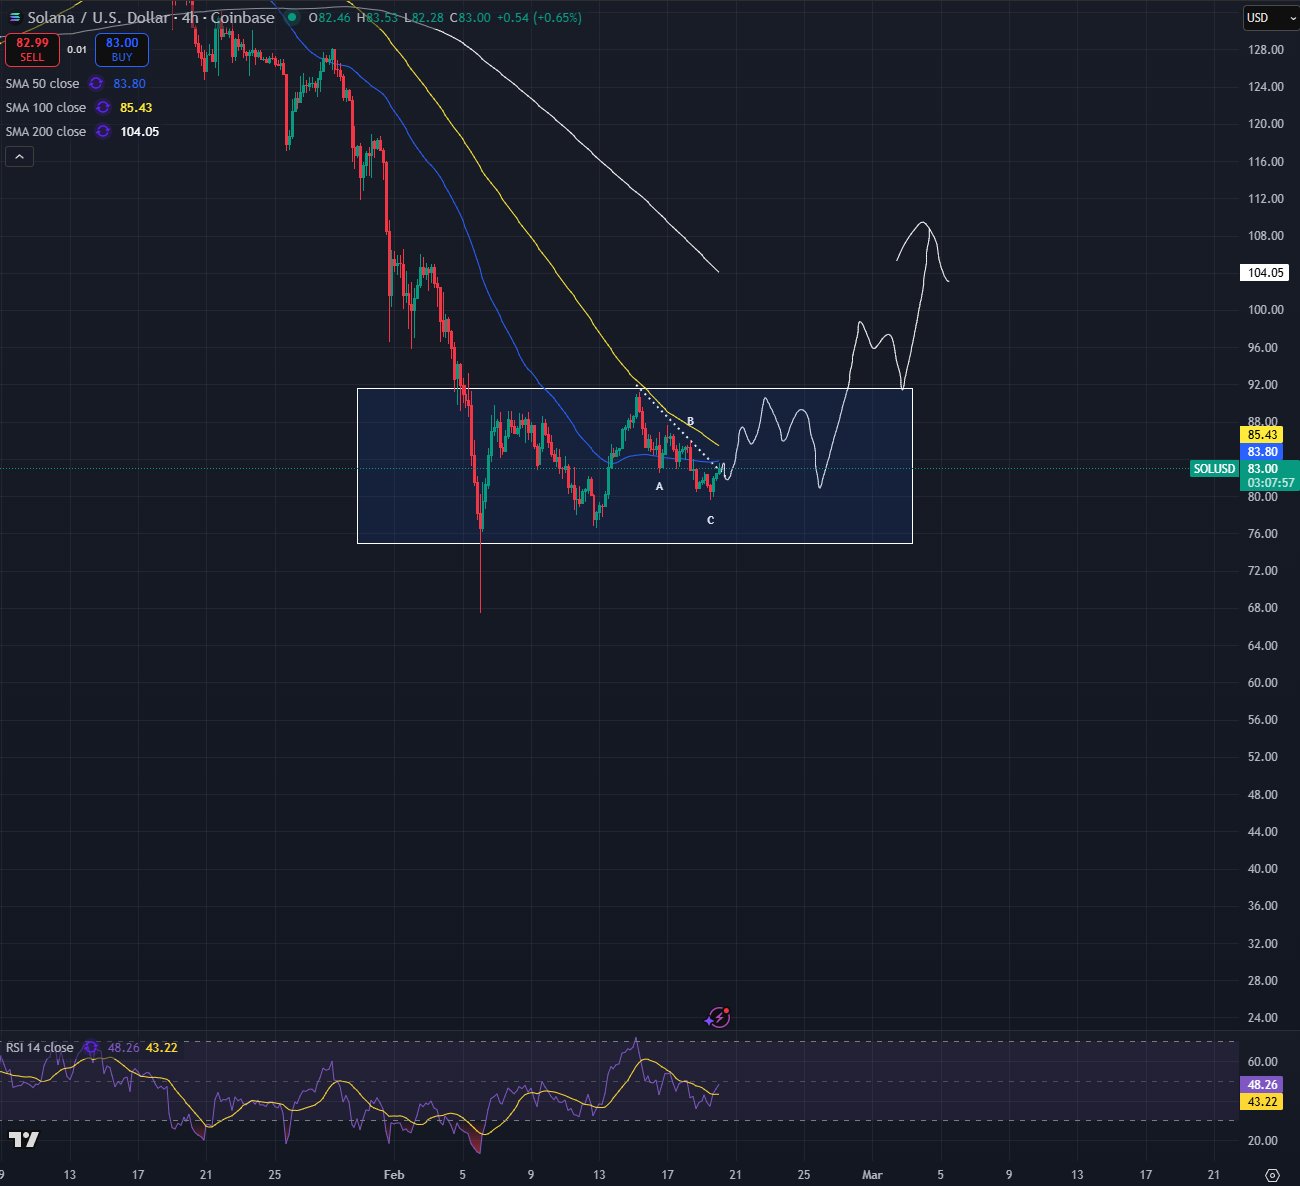
The chart placed SOL below the 50 period simple moving average near $83.80 and the 100 period simple moving average near $85.43.
Meanwhile, the 200 period average sat much higher near $104.05. Because price stayed under all three averages, trend signals on this time frame remained bearish.
At the same time, the spacing between price and the longer averages narrowed, which showed that downside momentum had slowed compared with the earlier leg lower.
Within the range, the analyst marked an A B C structure, with the most recent swing labeled near the lower boundary of the box. That placement framed current price action as range work rather than a fresh breakdown.
In parallel, the RSI hovered in the mid to high 40s, which showed weak momentum but no extended oversold condition.
Taken together, the chart context supported the view that SOL was building a base inside the range, even as price remained capped by declining averages overhead.
Disclosure:This article does not contain investment advice or recommendations. Every investment and trading move involves risk, and readers should conduct their own research when making a decision.
Kriptoworld.com accepts no liability for any errors in the articles or for any financial loss resulting from incorrect information.

Tatevik Avetisyan is an editor at Kriptoworld who covers emerging crypto trends, blockchain innovation, and altcoin developments. She is passionate about breaking down complex stories for a global audience and making digital finance more accessible.
📅 Published: February 20, 2026 • 🕓 Last updated: February 20, 2026
