Bitcoin traded near $86,956 on the BTCUSD daily chart on Bitstamp on Dec. 24, while the broader structure stayed in a downtrend.
Price has kept printing lower highs since the October peak, and it has continued to cap rebounds under a falling trendline, while the 50 day EMA sat near $93,067 above spot.
Stay ahead in the crypto world – follow us on X for the latest updates, insights, and trends!🚀
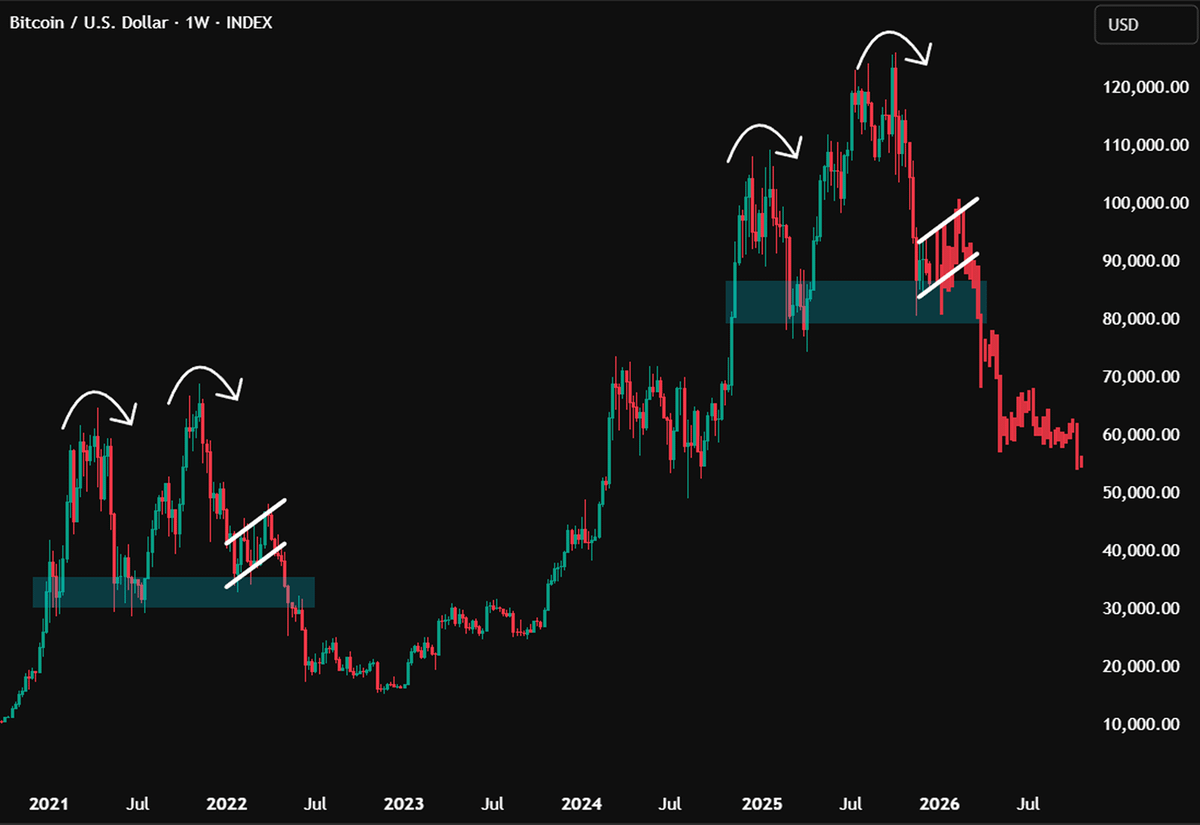
Price action since the sharp November slide has tightened into a bearish pennant, with candles compressing between converging trendlines near the mid to high $80,000s.
A bearish pennant is a short consolidation that forms after a strong drop, and it often acts as a pause before the prior move resumes.
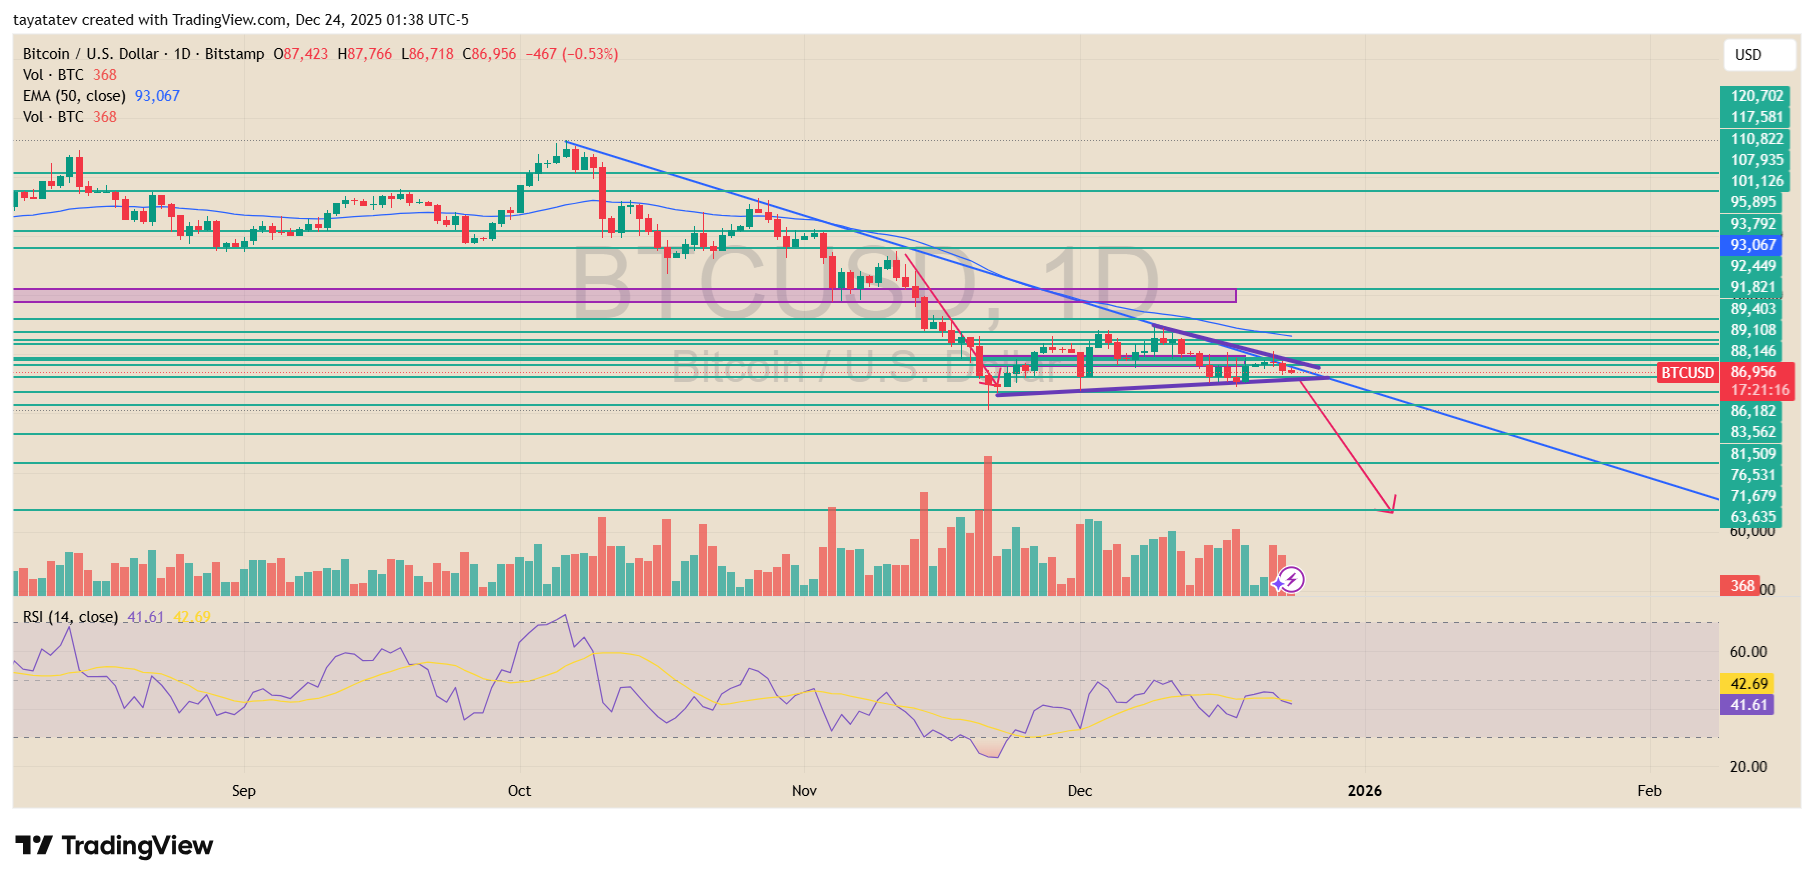
This setup leaves Bitcoin in a decision zone. On the downside, the chart shows nearby support around $86,182, then $83,562 and $81,509. If price breaks down from the pennant and sellers keep control, the pattern supports a continuation move.
A 27% decline from $86,956 points to about $63,480, which aligns with the $63,635 area marked on the chart.
On the upside, buyers would need a clean push back above the pennant and the nearby resistance bands around $88,146 to $89,108, and then reclaim higher levels into the low $90,000s to weaken the continuation case.
Momentum also stayed soft, with the 14 day RSI near 41.6, which kept it below the midline that often separates stronger from weaker trend conditions.
Binance liquidation heatmap highlights pressure zones around Bitcoin price
Meanwhile, The Binance BTC USDT liquidation heatmap over the past 24 hours shows Bitcoin trading inside a narrow range, while leverage clusters continue to shape short term price behavior.
The price moved mostly between $86,000 and $88,000, and the heatmap highlights where forced liquidations are most likely to occur if volatility expands.
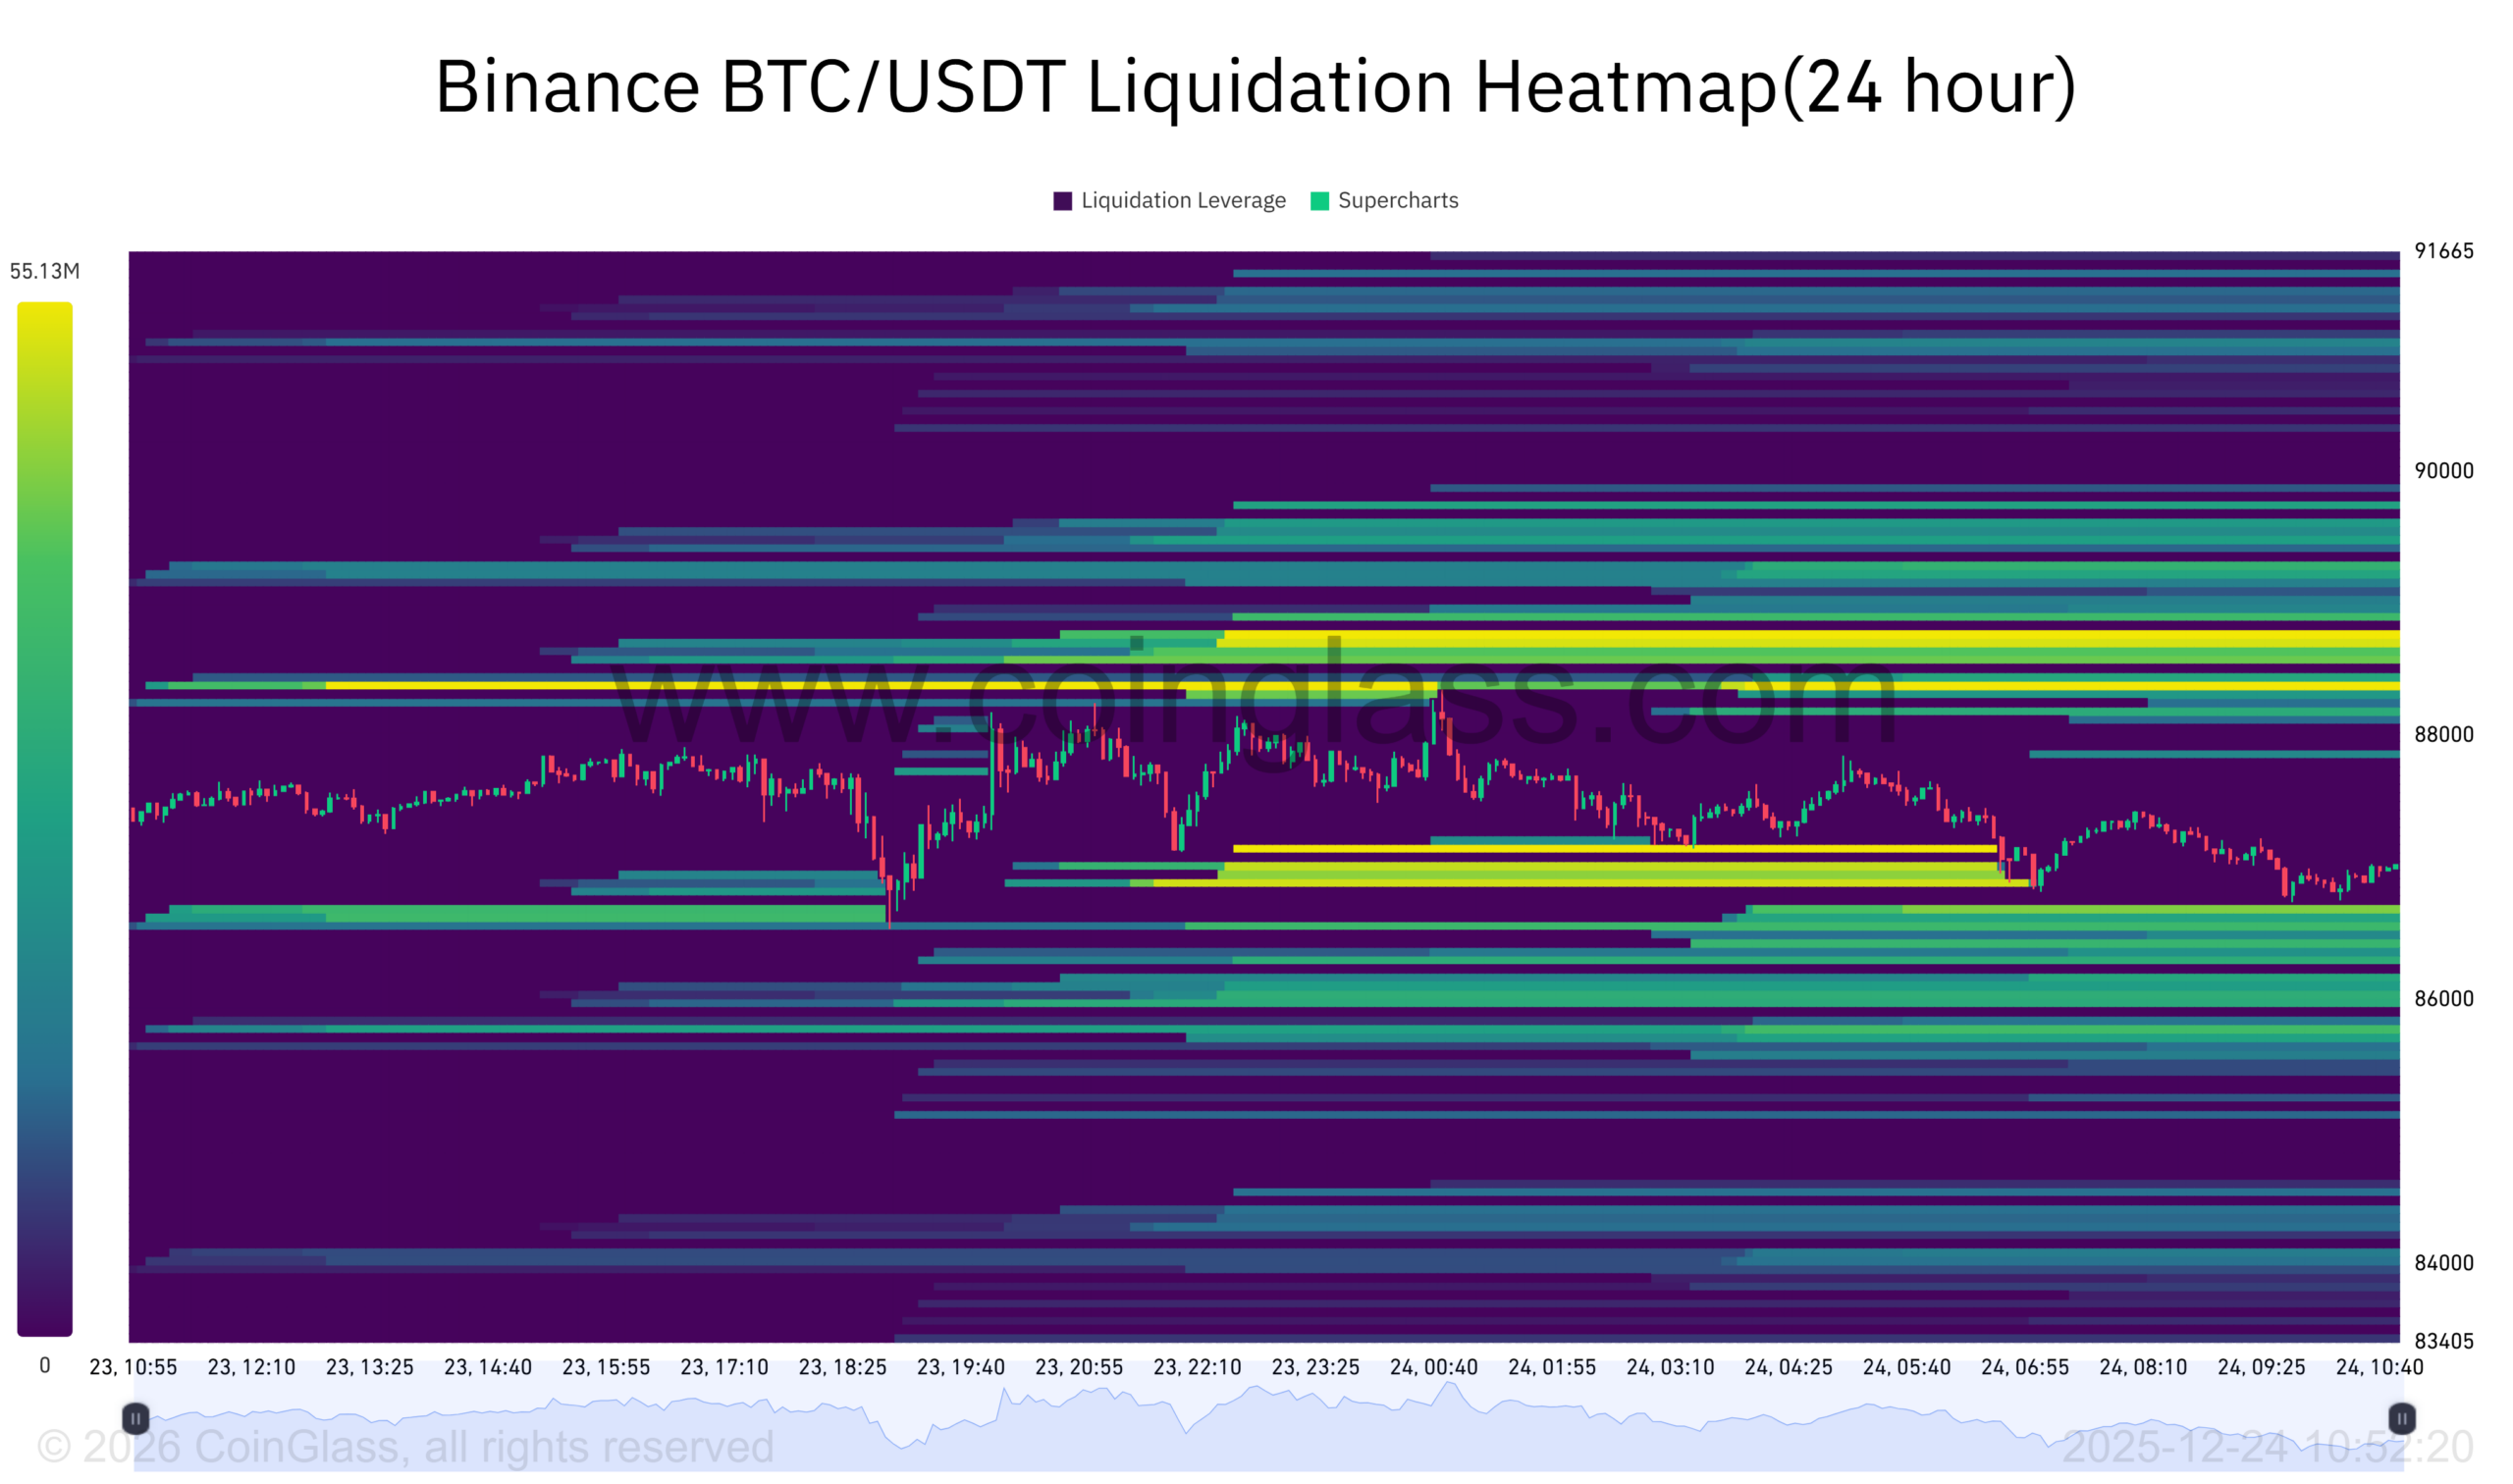
Above the market, the most concentrated liquidation zone sits around $88,800 to $89,500, shown by brighter bands.
This area signals stacked short leverage, meaning a sharp upward move could trigger liquidations and push price quickly into that zone. However, price has so far failed to sustain moves toward it, which keeps upside attempts capped in the short term.
Below the market, another dense cluster appears around $85,800 to $86,200, aligning with recent intraday lows.
This zone represents long leverage at risk. As price drifted lower during the session, it moved closer to this area, increasing the chance of downside liquidations if selling pressure resumes. The gradual slope lower into this band suggests controlled selling rather than panic.
Overall, the heatmap reflects a compression phase, where liquidity sits on both sides of price. Until one of these liquidation pools is cleared, Bitcoin is likely to remain range bound.
A decisive move into either zone could accelerate price action, while continued trading between them supports the broader consolidation seen on the chart.