


As of Dec. 23, 2025, the weekly SEI USDT chart on Binance shows price trading near $0.11, extending a steady decline that began after the mid-2025 rebound failed below the 50-week exponential moving average. The latest weekly candle holds near prior consolidation lows from late 2023, placing SEI at one of its weakest historical levels since listing. However, the chart does not yet confirm a clear historical bottom, as price continues to print lower lows without a strong reversal signal.
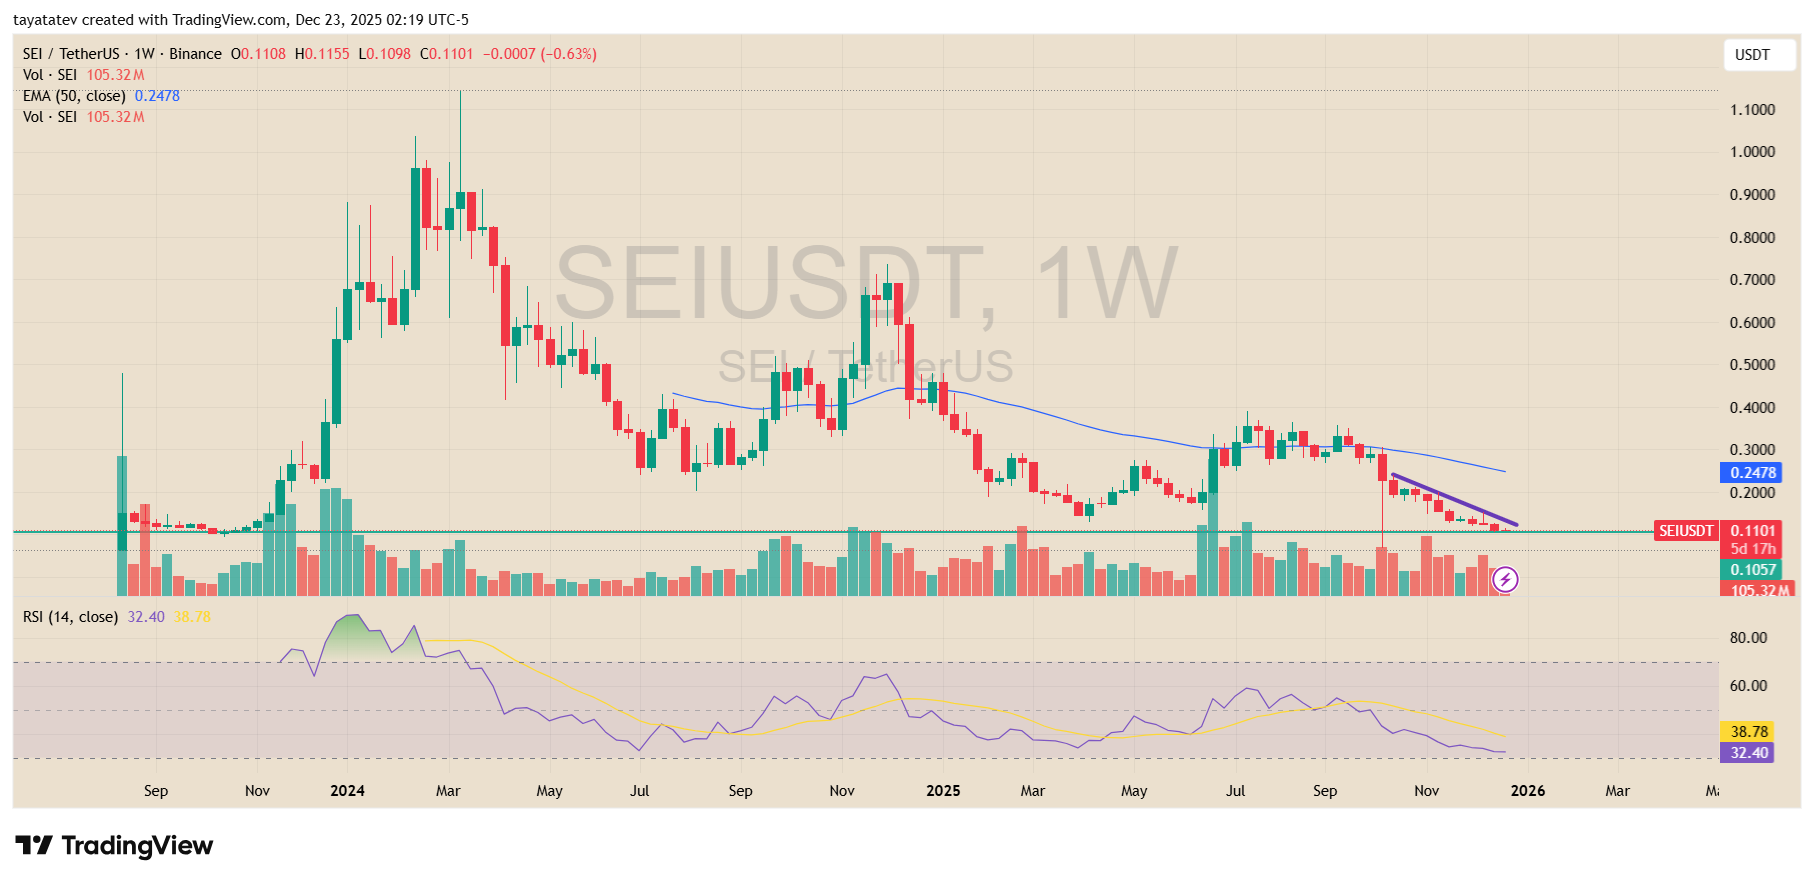
From a structure perspective, SEI remains in a broad downtrend on the weekly timeframe. Price stays below the 50-week EMA near $0.25, which has acted as dynamic resistance throughout 2025. Each recovery attempt stalled below that level, followed by renewed selling. The recent move lower also broke a short-term descending support trend, shown by the downward purple guide, reinforcing bearish continuation rather than exhaustion. At the same time, volume has not expanded aggressively on the latest decline, which suggests steady distribution rather than panic selling.
Momentum indicators show growing downside pressure but not a confirmed capitulation. The weekly RSI sits near 32, hovering just above oversold territory. Historically, SEI’s deeper cycle lows formed when RSI moved decisively below 30 and then reversed with bullish divergence. That signal has not appeared yet. Instead, RSI continues to slope lower, while its moving average also turns down, indicating momentum still favors sellers in the near term.
In historical context, the current price zone overlaps with early accumulation ranges seen before SEI’s first major expansion phase. That overlap explains why the area may attract attention as a potential long-term demand zone. However, the chart alone does not validate it as a confirmed bottom. A historical bottom would require either a strong weekly rejection with rising volume or a clear momentum divergence. Until such signals emerge, the data shows SEI trading at cycle-low territory, not a proven cycle low.
SEI Shows Short-Term Rebound Signals on 4-Hour Chart
Meanwhile, as of Dec. 22–23, 2025, the SEI USDT 4-hour chart shows early technical signals pointing to a short-term rebound after a prolonged intraday decline. The chart highlights a TD Sequential buy signal, marked after a completed downside count, which typically appears when selling pressure starts to weaken. Price reacted higher immediately after the signal, suggesting short-term sellers began to step aside.

At the same time, momentum data shows a bullish RSI divergence. While price printed a lower low near the $0.105 area, the RSI formed a higher low. This divergence signals that downside momentum weakened even as price briefly pushed lower. Such setups often appear near short-term reaction lows, especially after sharp selloffs.
Price has since rebounded toward the $0.112 zone, reclaiming nearby intraday levels. The structure shows a quick recovery rather than a slow grind, which supports the idea of a technical bounce rather than continued immediate weakness. However, the move remains corrective within a broader downtrend, as higher time frames still show price below key resistance levels.
Overall, the 4-hour data points to a short-term rebound in progress, driven by momentum divergence and TD buy signals. Still, confirmation depends on follow-through above nearby resistance and sustained RSI strength, as the broader trend remains unresolved.
Disclosure:This article does not contain investment advice or recommendations. Every investment and trading move involves risk, and readers should conduct their own research when making a decision.
Kriptoworld.com accepts no liability for any errors in the articles or for any financial loss resulting from incorrect information.

Tatevik Avetisyan is an editor at Kriptoworld who covers emerging crypto trends, blockchain innovation, and altcoin developments. She is passionate about breaking down complex stories for a global audience and making digital finance more accessible.
📅 Published: December 23, 2025 • 🕓 Last updated: December 23, 2025
