

 at crossroads as head and shoulders pattern meets 2024 style breakout setup")
Bitcoin trades near key support levels as chartists split over whether the next big move is higher or lower.
New analyses highlight a possible head-and-shoulders top, a 2024-style accumulation pattern, large buy walls around $101,000, and an “extreme fear” sentiment reading.
Stay ahead in the crypto world – follow us on X for the latest updates, insights, and trends!🚀
Crypto analyst Ali said Bitcoin may be forming a head-and-shoulders pattern on the daily chart, signaling a possible shift in trend.
He noted that price could first rebound toward about $112,000, which would complete the pattern’s right shoulder.
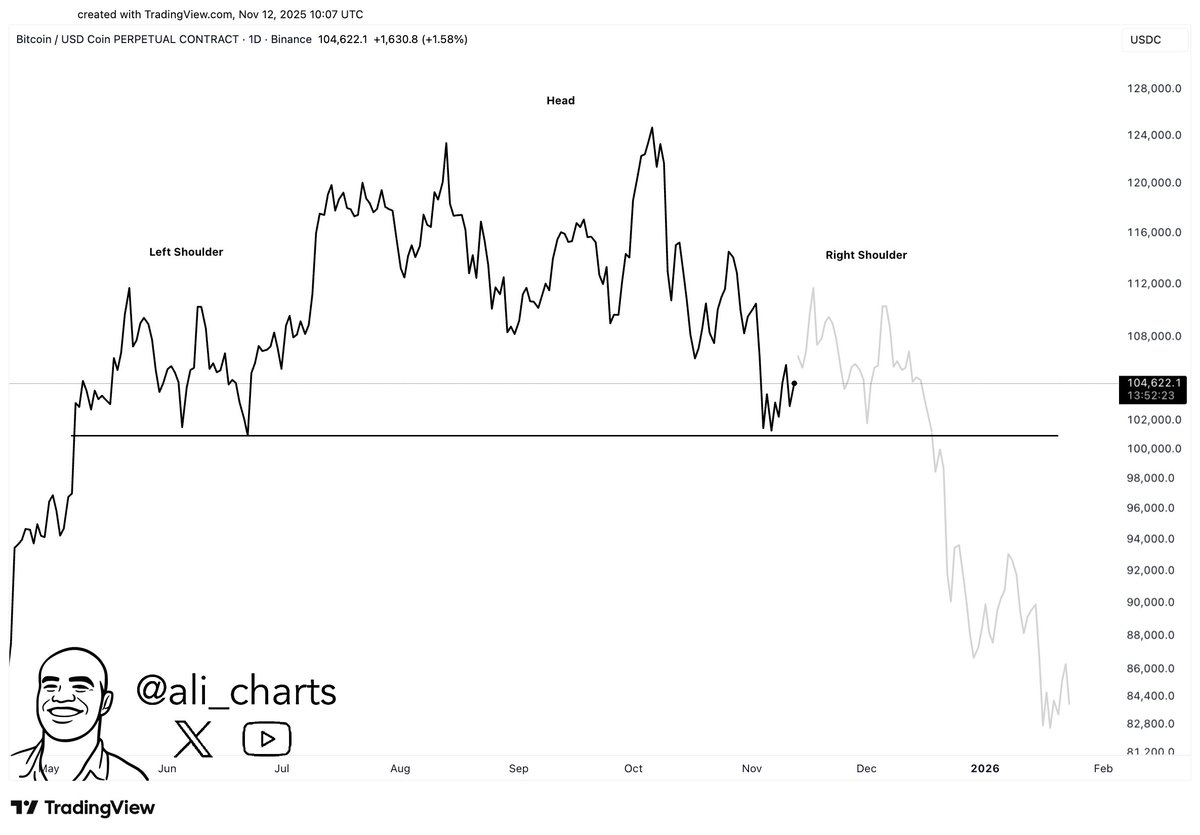
After that move, Ali added, Bitcoin could retest the $100,000 area that lines up as the neckline.
If the market then breaks below that support with conviction, the chart projection points to a potential downside target near $83,000.
Analyst says Bitcoin is echoing its 2024 accumulation-to-breakout pattern
Trader Giannis Andreou said Bitcoin’s latest pullback aligns closely with the structure that preceded its early-2024 breakout.
He pointed to a clear accumulation range that stretched through the past few months, resembling the consolidation zone seen in late 2023 and early 2024 before Bitcoin advanced.
The chart he shared shows repeated tests of the same band, indicating steady absorption rather than a trend reversal.
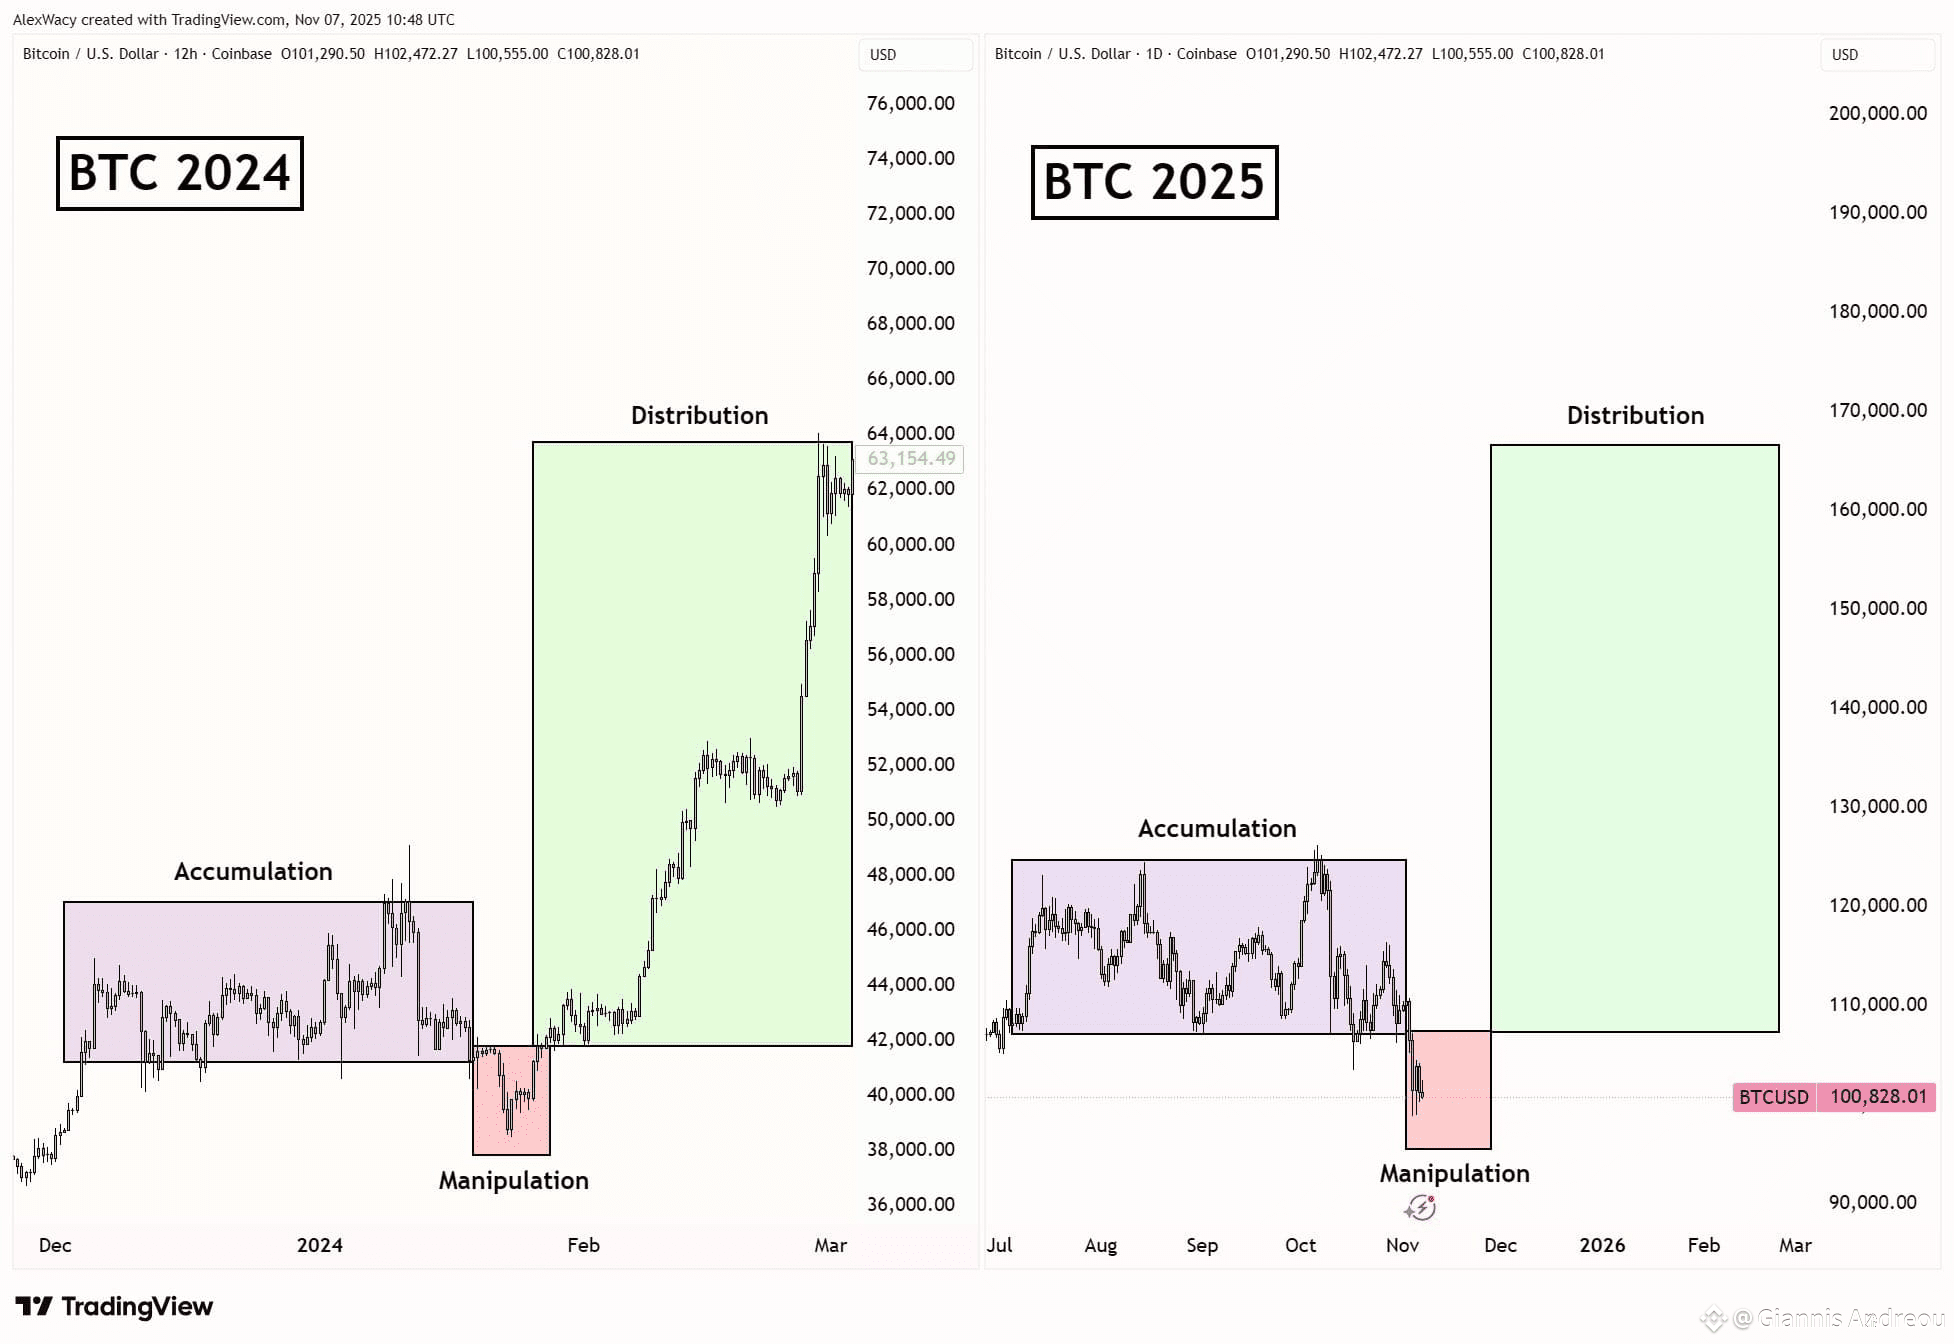
As price slipped below the range this week, Andreou described the move as a “manipulation dip.”
In his view, this phase mirrors the brief shakeout that hit Bitcoin in January 2024, when price dropped sharply before recovering.
He argued that such dips tend to pressure sentiment, force panic selling, and reset positioning before a stronger trend can resume.
Andreou added that the next stage in the structure is typically a vertical breakout phase. In 2024, that move lifted Bitcoin rapidly from the low $40,000s toward new highs.
He suggested that the same cycle of accumulation, manipulation, and breakout may be unfolding again, noting that the emotional pattern among traders appears similar to the prior year.
Large Bitcoin buy orders cluster near key support zone
Market watcher Ted highlighted a buildup of buy orders between $100,500 and $101,000 on Binance’s order book.
He noted that this pocket of liquidity has grown steadily, showing interest from buyers positioned just below current price.
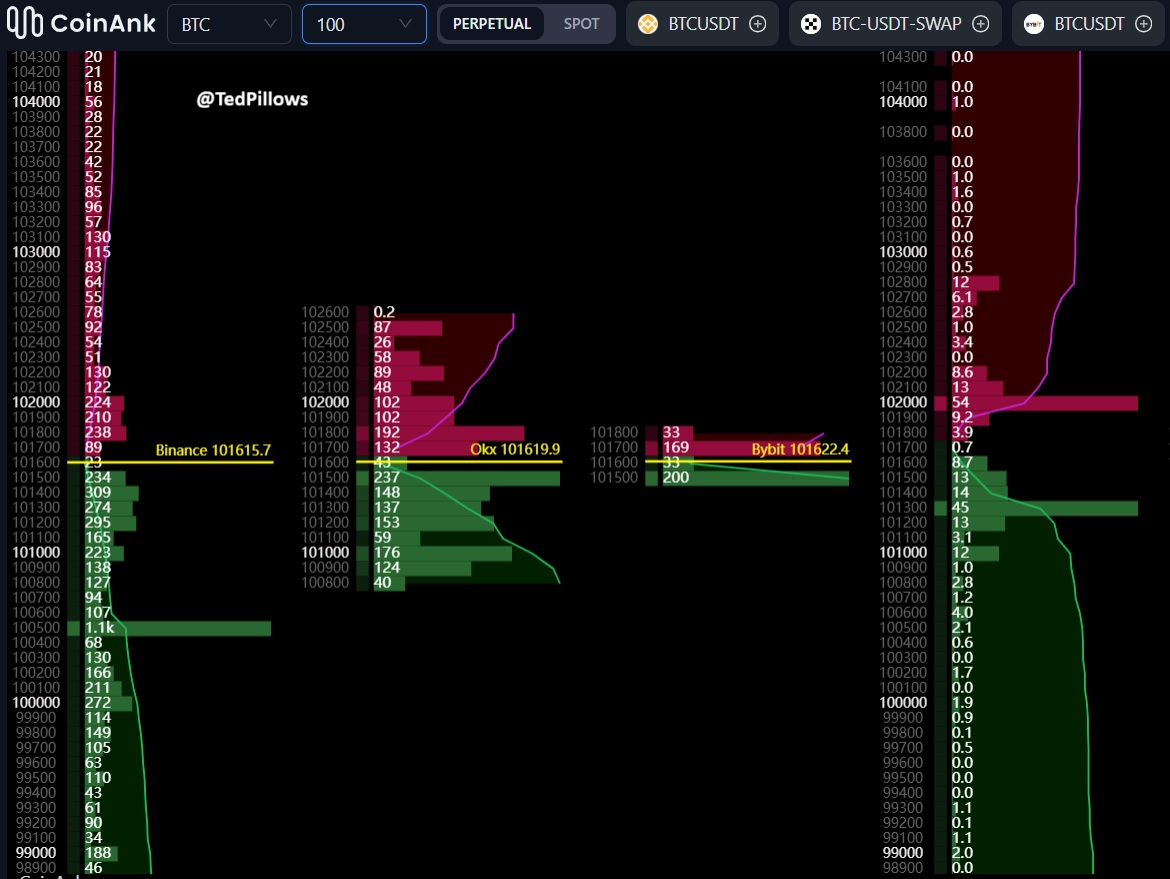
The heatmap shows concentrated bids stacked across several levels, forming one of the strongest supports on the short-term chart.
Such clusters often act as buffers during sell-offs, absorbing pressure as price approaches the zone.
Ted added that if Bitcoin stages a rebound, this area is the most likely point for a reaction given the depth of resting bids. The order flow suggests traders are preparing to defend the level should price retest it.
Bitcoin sentiment gauge falls into ‘extreme fear’ zone
Meanwhile, the Bitcoin Fear & Greed Index dropped to 15 on Wednesday, signaling “extreme fear” across the crypto market.
The gauge, compiled by Alternative.me, blends volatility, volume, social media activity, dominance, and trends to track investor mood.
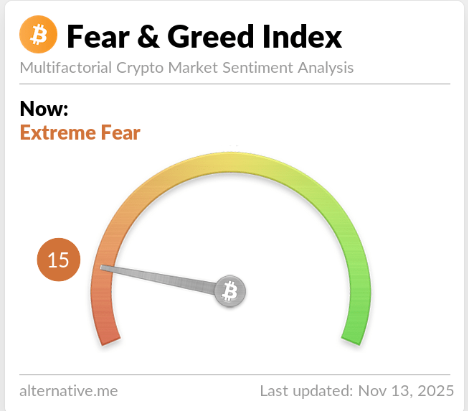
This latest reading shows sentiment has swung sharply toward caution after recent price losses.
Historically, such low scores have appeared during periods of heavy uncertainty, as traders cut risk and wait for clearer direction.
Disclosure:This article does not contain investment advice or recommendations. Every investment and trading move involves risk, and readers should conduct their own research when making a decision.
Kriptoworld.com accepts no liability for any errors in the articles or for any financial loss resulting from incorrect information.

Tatevik Avetisyan is an editor at Kriptoworld who covers emerging crypto trends, blockchain innovation, and altcoin developments. She is passionate about breaking down complex stories for a global audience and making digital finance more accessible.
📅 Published: November 13, 2025 • 🕓 Last updated: November 13, 2025
