


Binance Coin (BNB) broke upward from a four-hour falling wedge on Friday, Oct 24, 2025, and pressed about 4% above the pattern’s upper trendline.
A falling wedge is a bullish reversal/continuation setup where price makes lower highs and lower lows inside converging, downward-sloping lines, then typically resolves higher once resistance snaps.
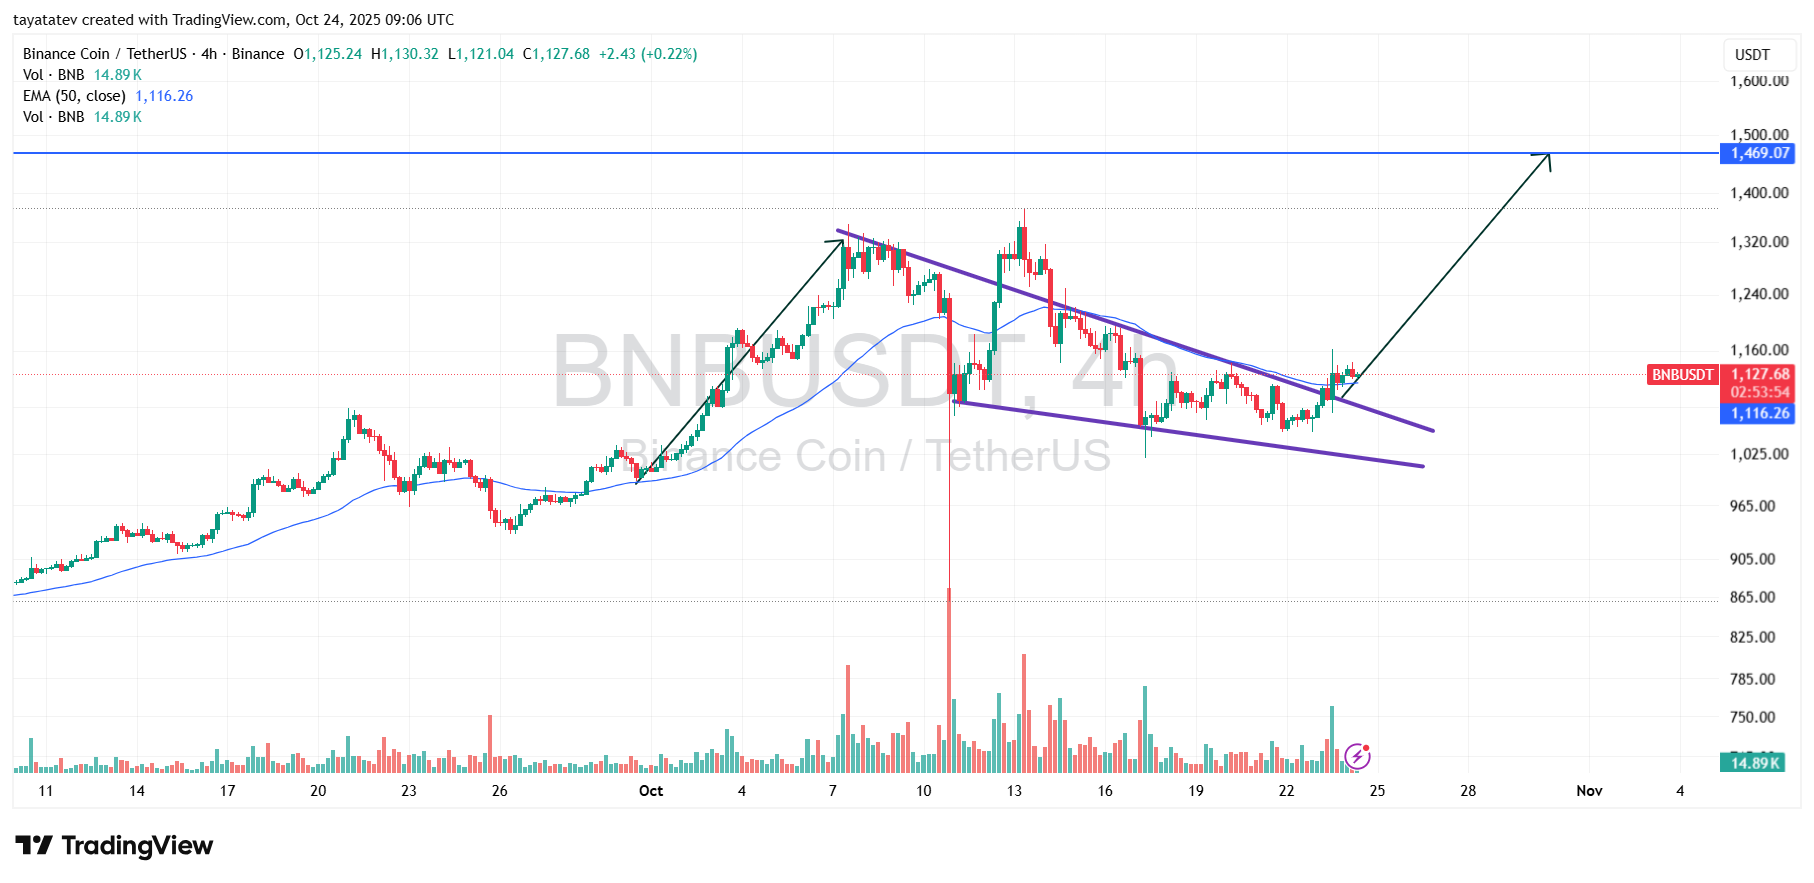
Price trades near $1,128, sitting above the 50-EMA around $1,116, which now acts as first support. Volume spiked on the breakout, and candles closed outside the wedge, signaling confirmation rather than a mere intraday poke.
As momentum shifts, the market opens room for follow-through while the broken trendline and $1,116 area provide a nearby backstop if price retests.
From here, we expect a measured advance of roughly 30% from the current level, projecting toward ~$1,466, which aligns with the marked overhead zone around $1,469.
The path includes interim friction near recent swing pivots, yet sustained closes above the breakout area keep the upside scenario intact.
The bullish case weakens only if BNB slips back into the wedge and loses the $1,116–$1,120 shelf with decisive volume; otherwise, the breakout structure favors an extension toward the ~$1.47k objective.
BNB retests the Fibonacci golden zone
BNB is testing the Fibonacci 0.618 “golden ratio” at around $1,139, measured from the late-September swing low near $981 to the October peak close to $1,376.
In technical analysis, the 0.618 level is considered the most important retracement zone because it often marks the end of corrective phases inside a larger uptrend.
When price pulls back into the golden pocket and then stabilizes, buyers commonly attempt to regain control. On Oct 24, BNB is trading directly on this cluster, using it as a decision point while volume begins to rise after the breakout from the falling wedge.
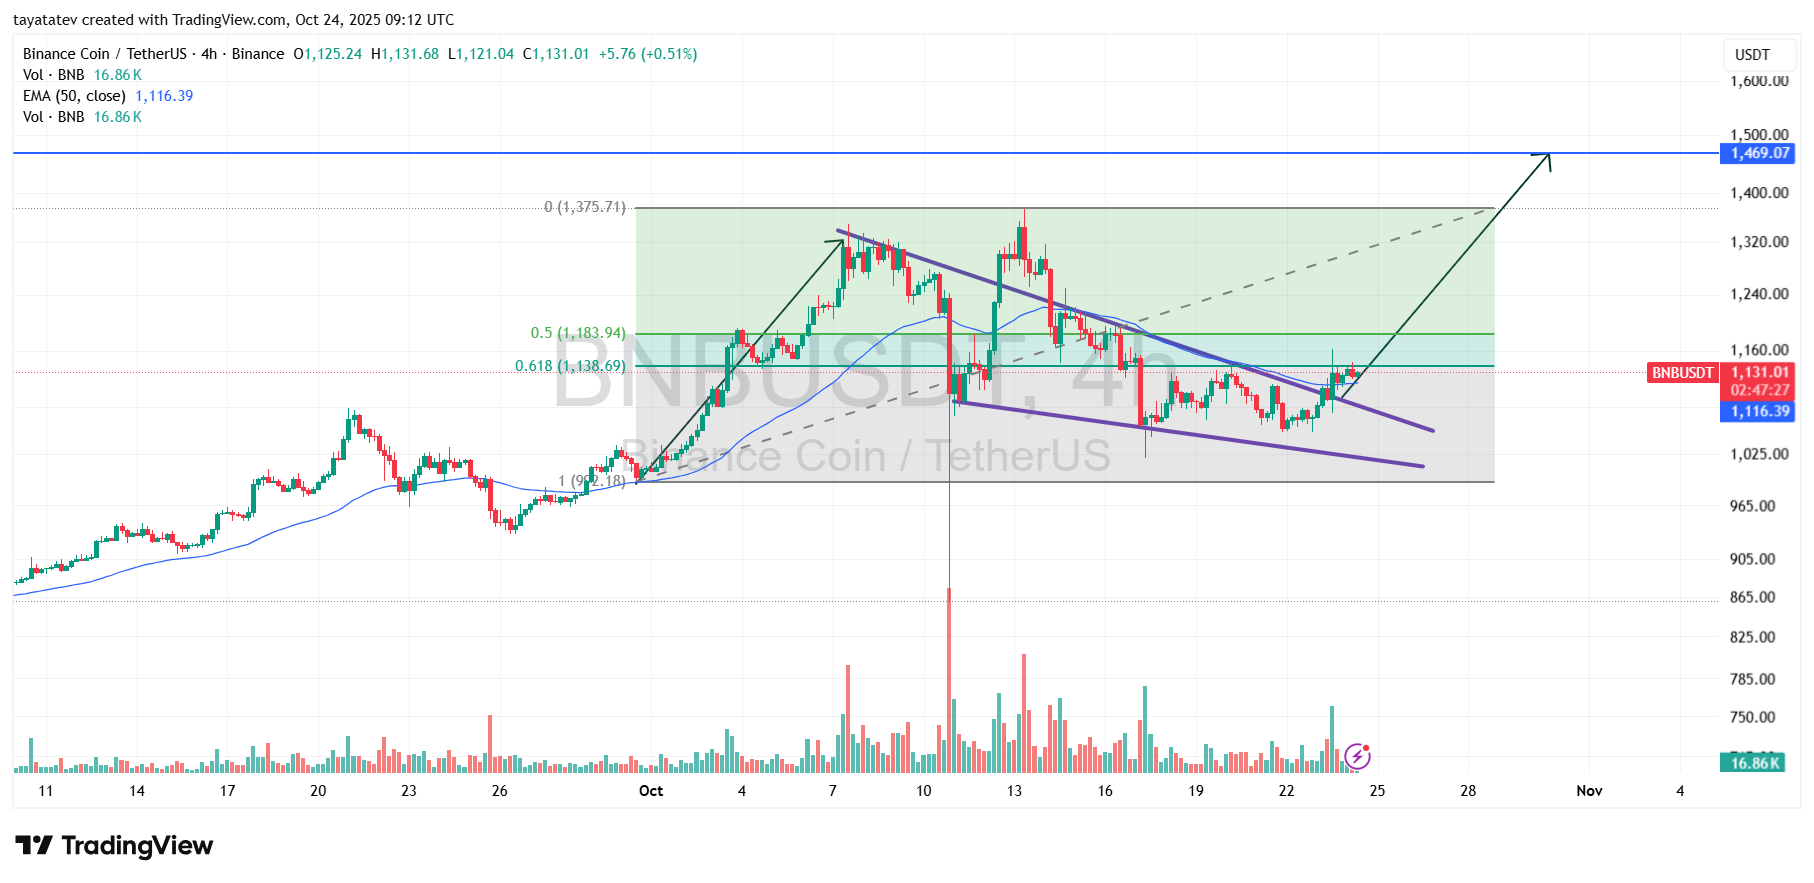
A clean 4-hour close above the golden pocket would confirm it as support and shift focus to the next Fibonacci checkpoint at the 0.5 level near $1,184.
That would signal momentum continuation and strengthen the case for a broader recovery toward the recent range highs.
However, if BNB repeatedly fails to close above $1,139 and loses momentum, the market could slide back toward the breakout zone for a retest before any second attempt higher.
In short, the Fibonacci structure shows that the golden pocket is the line between trend continuation and temporary consolidation, making it the critical level to watch in the current setup.
BNB 4H RSI flips momentum on Oct 24
BNB’s 14-period RSI rebounded from mid-October sub-30 lows to ~57–58 on Oct 24, crossing both its signal line and the 50 baseline.
That shift marks a move from bearish to constructive momentum and leaves headroom before the overbought band near 70.
The sequence of higher RSI lows since last week supports a building upswing after the falling-wedge break.
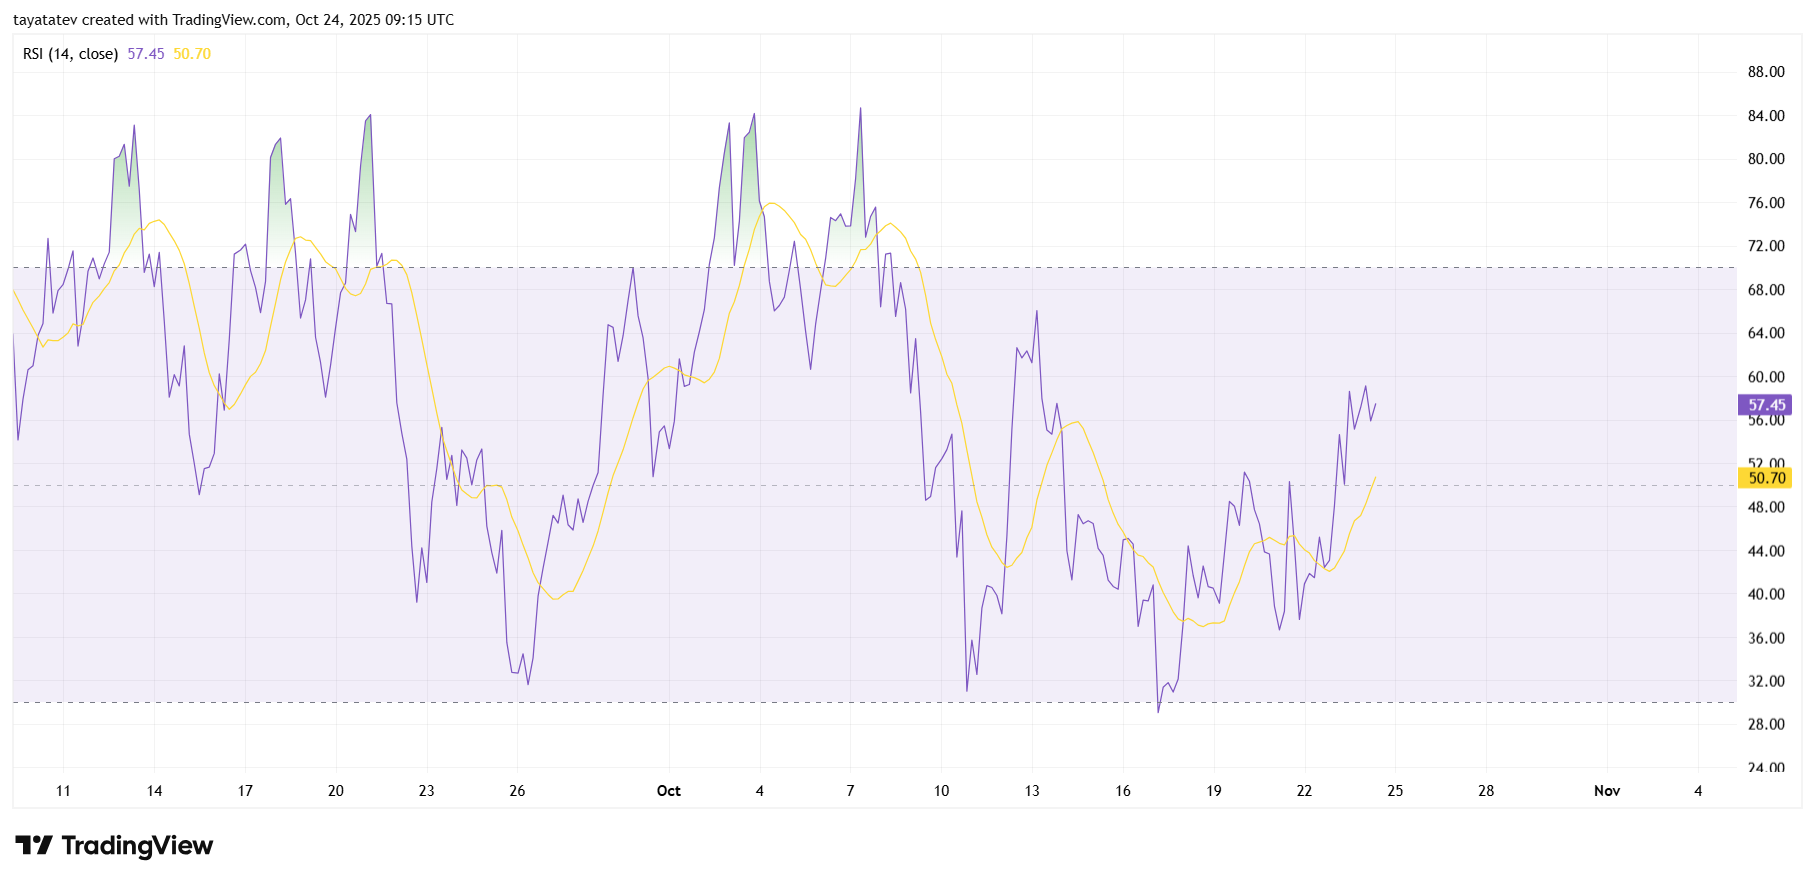
From here, holding above 50 keeps bulls in control and favors a push into the 62–70 zone, which typically accompanies trend continuation. However, a quick slip back under 50 with the RSI line crossing below its signal would hint at a failed momentum flip and raise odds of a price retest.
Until that reversal shows, the oscillator points to improving strength with room to extend.

Tatevik Avetisyan is an editor at Kriptoworld who covers emerging crypto trends, blockchain innovation, and altcoin developments. She is passionate about breaking down complex stories for a global audience and making digital finance more accessible.
📅 Published: October 24, 2025 • 🕓 Last updated: October 24, 2025
Disclosure:This article does not contain investment advice or recommendations. Every investment and trading move involves risk, and readers should conduct their own research when making a decision.
Kriptoworld.com accepts no liability for any errors in the articles or for any financial loss resulting from incorrect information.
