

 Bullish Flag Points to 141% Move Toward $1.63")
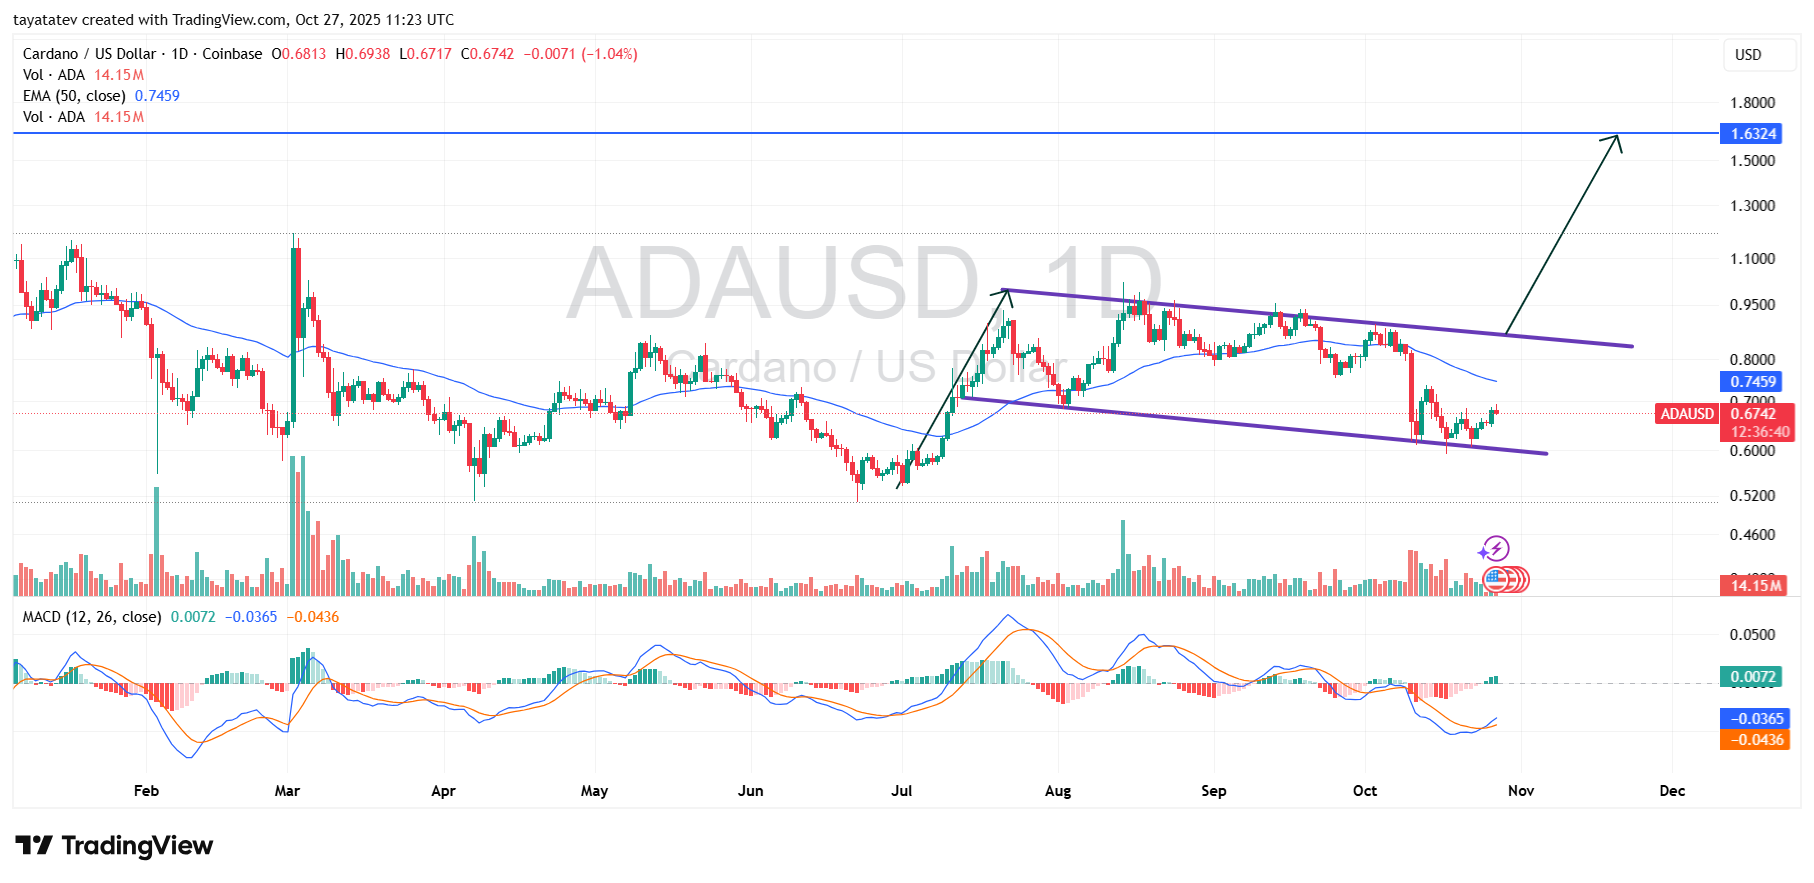
Cardano (ADA) printed a textbook bullish flag pattern on the daily chart as of October 27, 2025, after a strong rally in July–August was followed by a downward-sloping consolidation channel.
The price now trades near $0.67 and continues to hold the lower boundary of the flag, while momentum indicators like MACD show early recovery signals.
A bullish flag forms after a sharp upward move (the pole) and is followed by a tight, descending or sideways consolidation (the flag).
The pattern is seen as a continuation structure in technical analysis, often signaling that buyers are pausing before attempting the next leg higher. In the current ADA structure, the July breakout created the pole, while the purple channel on the chart marks the flag.
If ADA confirms a breakout above the upper trendline of the flag, the pattern projects a potential measured move of around 141% from the current range.
The technical target in this scenario aligns near $1.63, where previous resistance sits above the psychological $1 level. However, the confirmation requires a daily close above the flag’s upper boundary and sustained volume expansion to validate bullish continuation.
The 50-day EMA at $0.74 is the first barrier to reclaim. A clean break above that line would strengthen bullish sentiment and increase the probability of a flag breakout.
Until then, ADA remains inside the consolidation channel, with the trend neutral but biased to the upside as long as price holds above the lower boundary.
ADAUSD rebounds from a second basing box
Cardano’s daily chart dated Oct 24, 2025 shows ADA closing near $0.6415 after a session that opened at $0.6239, hit $0.6543, and dipped to $0.6230.
The annotation highlights two grey “boxes” where price compressed, suggesting repeated accumulation after declines. ű
The most recent box spans roughly $0.60–$0.65, and the hand-drawn path implies a continuation higher once price clears the box top.
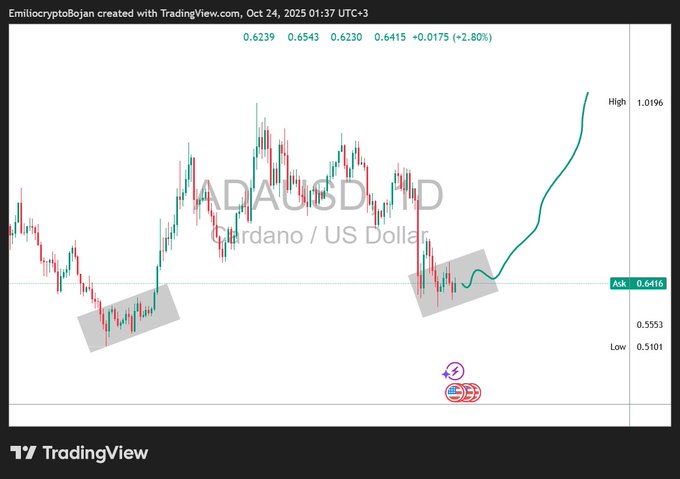
A basing box is a tight range that forms after a selloff as supply and demand rebalance. When price reclaims the range high and holds above it, the setup often resolves into a trend resumption.
Here, a daily close and follow-through above ~$0.65 would confirm strength and open the way toward the next supply zones around $0.70–$0.75, where September swing highs capped rallies.
Conversely, failure back below ~$0.60 would weaken the base and expose $0.555 and $0.510 (levels shown on the chart).
Because volume is not displayed, confirmation should include rising turnover accompanying any breakout to validate momentum.
Disclosure:This article does not contain investment advice or recommendations. Every investment and trading move involves risk, and readers should conduct their own research when making a decision.
Kriptoworld.com accepts no liability for any errors in the articles or for any financial loss resulting from incorrect information.

Tatevik Avetisyan is an editor at Kriptoworld who covers emerging crypto trends, blockchain innovation, and altcoin developments. She is passionate about breaking down complex stories for a global audience and making digital finance more accessible.
📅 Published: October 27, 2025 • 🕓 Last updated: October 27, 2025
