


A social media post claiming Cardano’s ADA “will 2X real quick” circulated on X on Jan. 19 as the token traded lower on a daily chart that still shows a broader downtrend.
The message came from the account The Value Trader, which also shared a TradingView chart of ADA against the U.S. dollar on Coinbase.
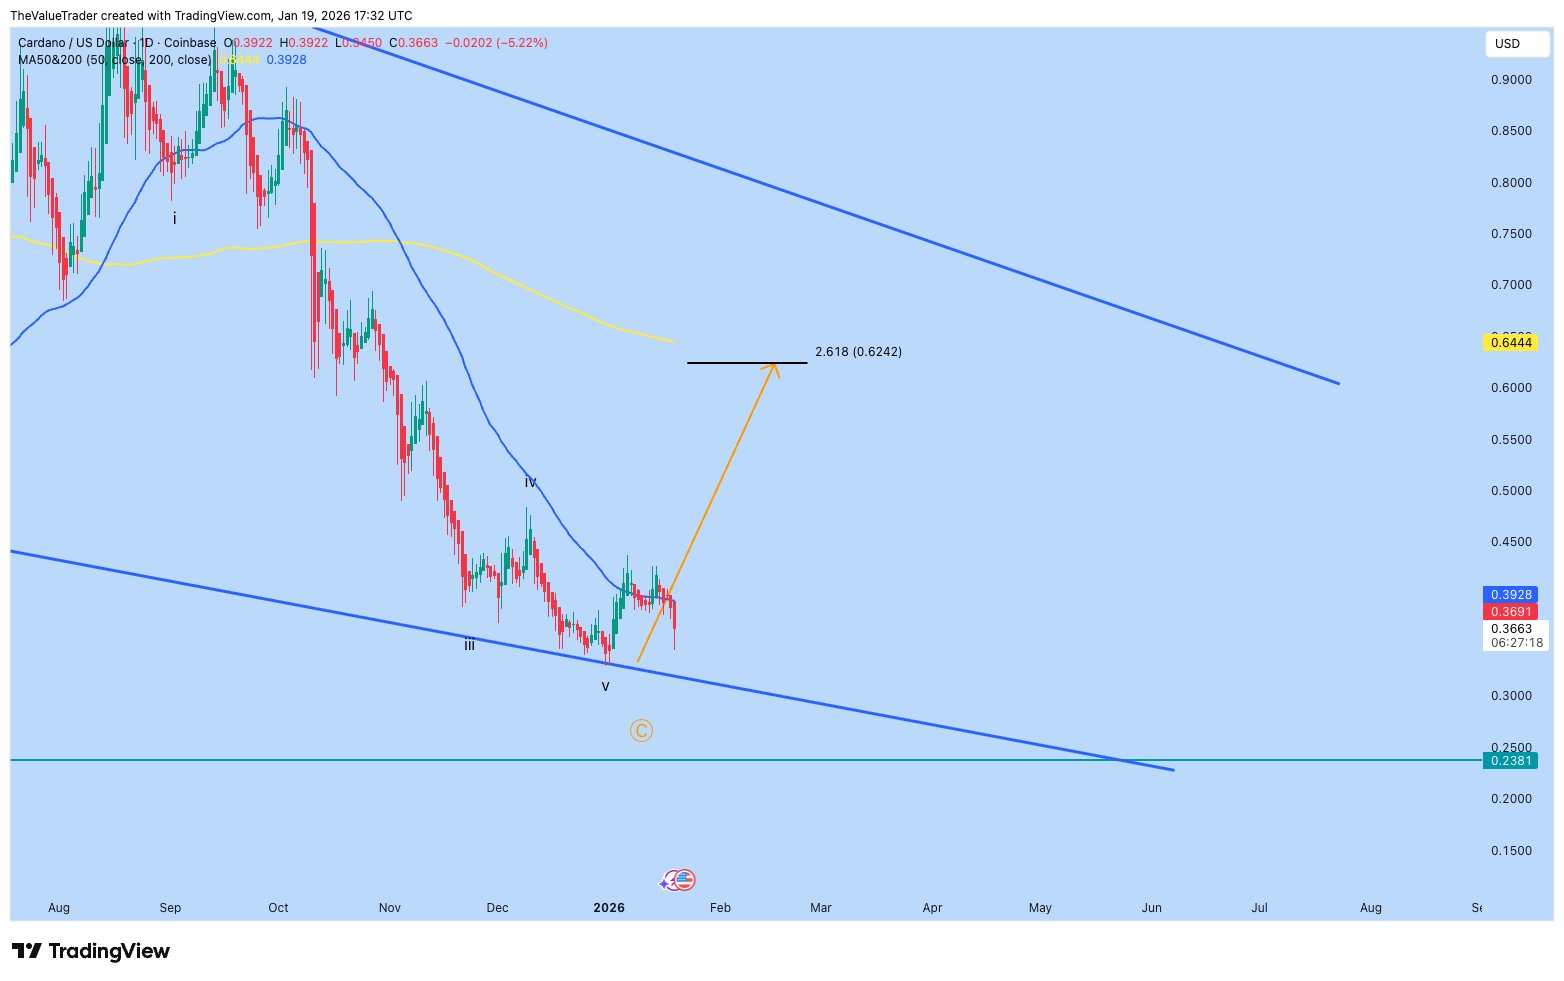
On that chart, ADA printed a close near $0.3663, down about 5.22% on the session, after failing to hold a short rebound.
Price remained below the 50 day moving average, marked near $0.3928, while the 200 day moving average sat much higher around $0.6444, reinforcing that the market still trades under longer term resistance.
The chart framed ADA inside a descending channel that has guided price since late 2025, with recent candles clustering near the lower boundary.
The analyst’s drawing highlighted a potential upside path toward a marked level near $0.6242, labeled as a 2.618 extension, which would still fall short of a clean “2X” from $0.3663, a move that would imply roughly $0.73.
At the same time, the same visual showed a lower reference level near $0.2381, suggesting where the next downside zone could sit if the channel support fails.
In that setup, a sustained recovery would likely require ADA to reclaim nearby resistance first and then challenge the higher average, because the chart’s moving average stack and descending structure continue to define the trend.
Cardano price holds near $0.37 while chart sets $0.404 as rebound trigger
Cardano’s ADA traded around $0.3698 on a 30 minute ADAUSD chart from Kraken as it retested a key Fibonacci zone that an analyst framed as a make or break area for the next move.
The chart, shared by More Crypto Online on X, showed ADA probing the 78.6% retracement near $0.3491 after a sharp drop, before rebounding back toward the mid range.
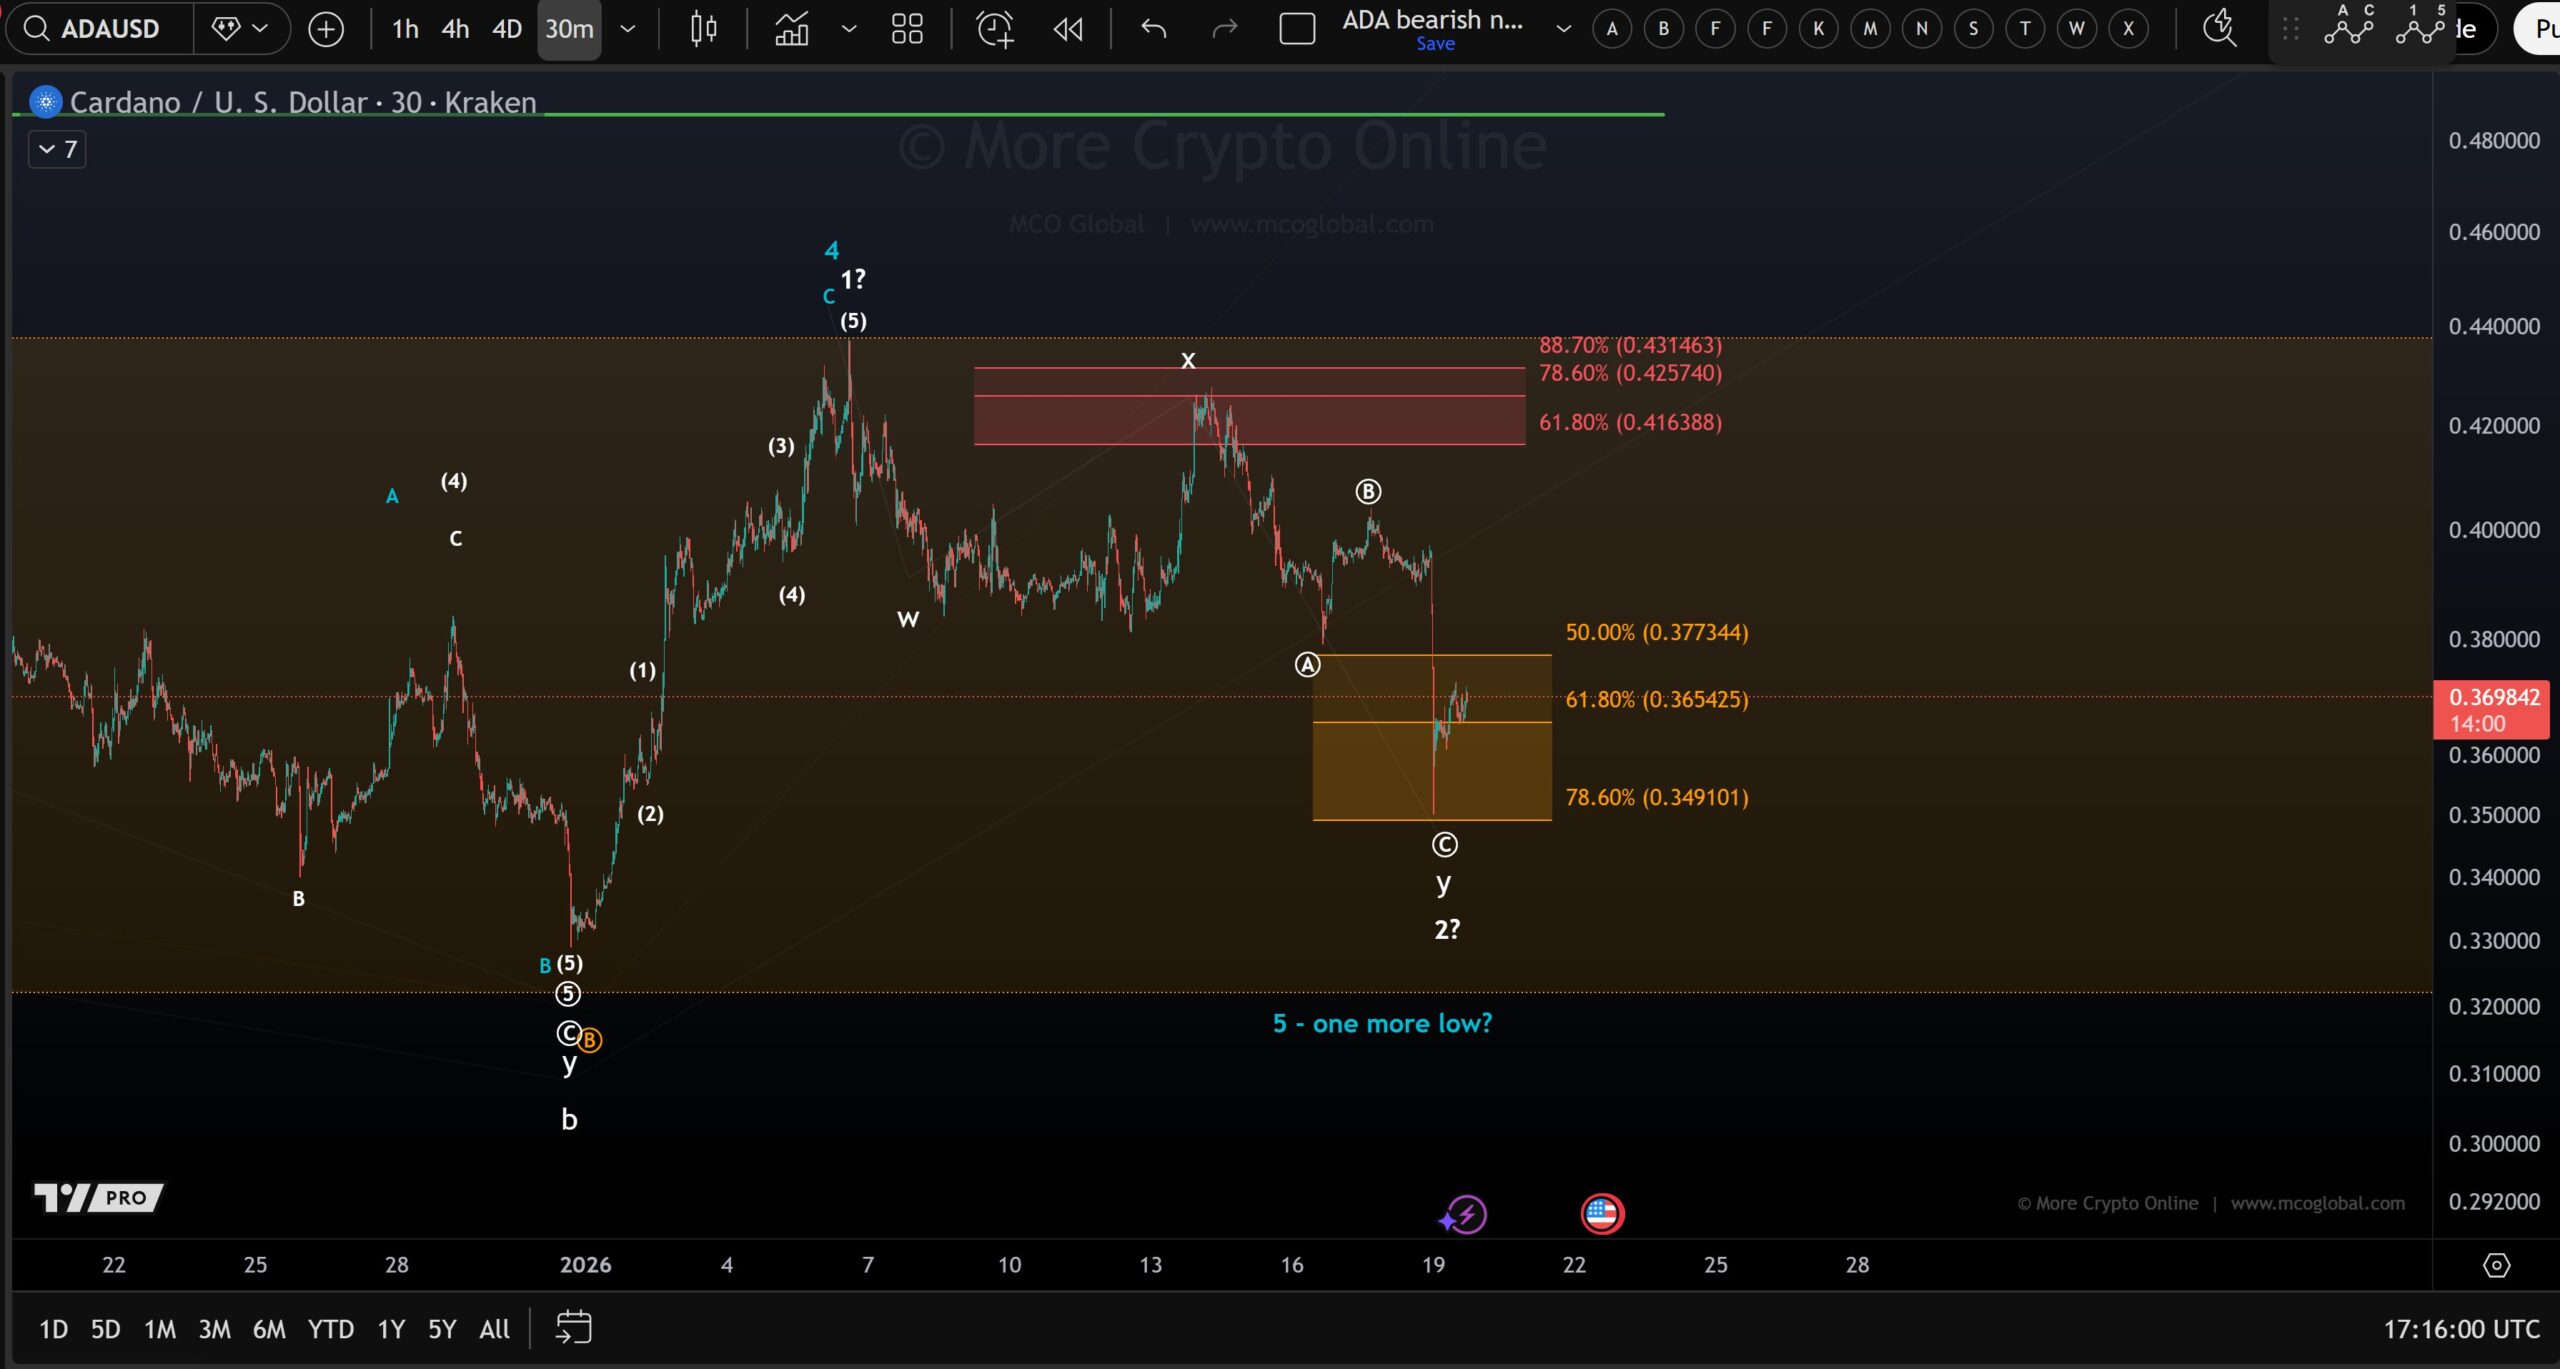
In the analyst’s setup, $0.328 marked the invalidation point for a “1 2” wave structure, meaning a move below that level would weaken the bullish count shown on the chart.
The same post said ADA needs a break above $0.404 to indicate a low has formed, putting the focus on whether the bounce can extend beyond nearby resistance rather than fading inside the retracement box.
The plotted levels highlighted short term checkpoints. The 61.8% retracement sat near $0.3654, close to the current price, while the 50% level appeared near $0.3773.
Above that, a separate resistance band on the chart clustered between roughly $0.4137 and $0.4315, suggesting the market may face selling pressure if it pushes into that zone.
Disclosure:This article does not contain investment advice or recommendations. Every investment and trading move involves risk, and readers should conduct their own research when making a decision.
Kriptoworld.com accepts no liability for any errors in the articles or for any financial loss resulting from incorrect information.

Tatevik Avetisyan is an editor at Kriptoworld who covers emerging crypto trends, blockchain innovation, and altcoin developments. She is passionate about breaking down complex stories for a global audience and making digital finance more accessible.
📅 Published: January 20, 2026 • 🕓 Last updated: January 20, 2026
