


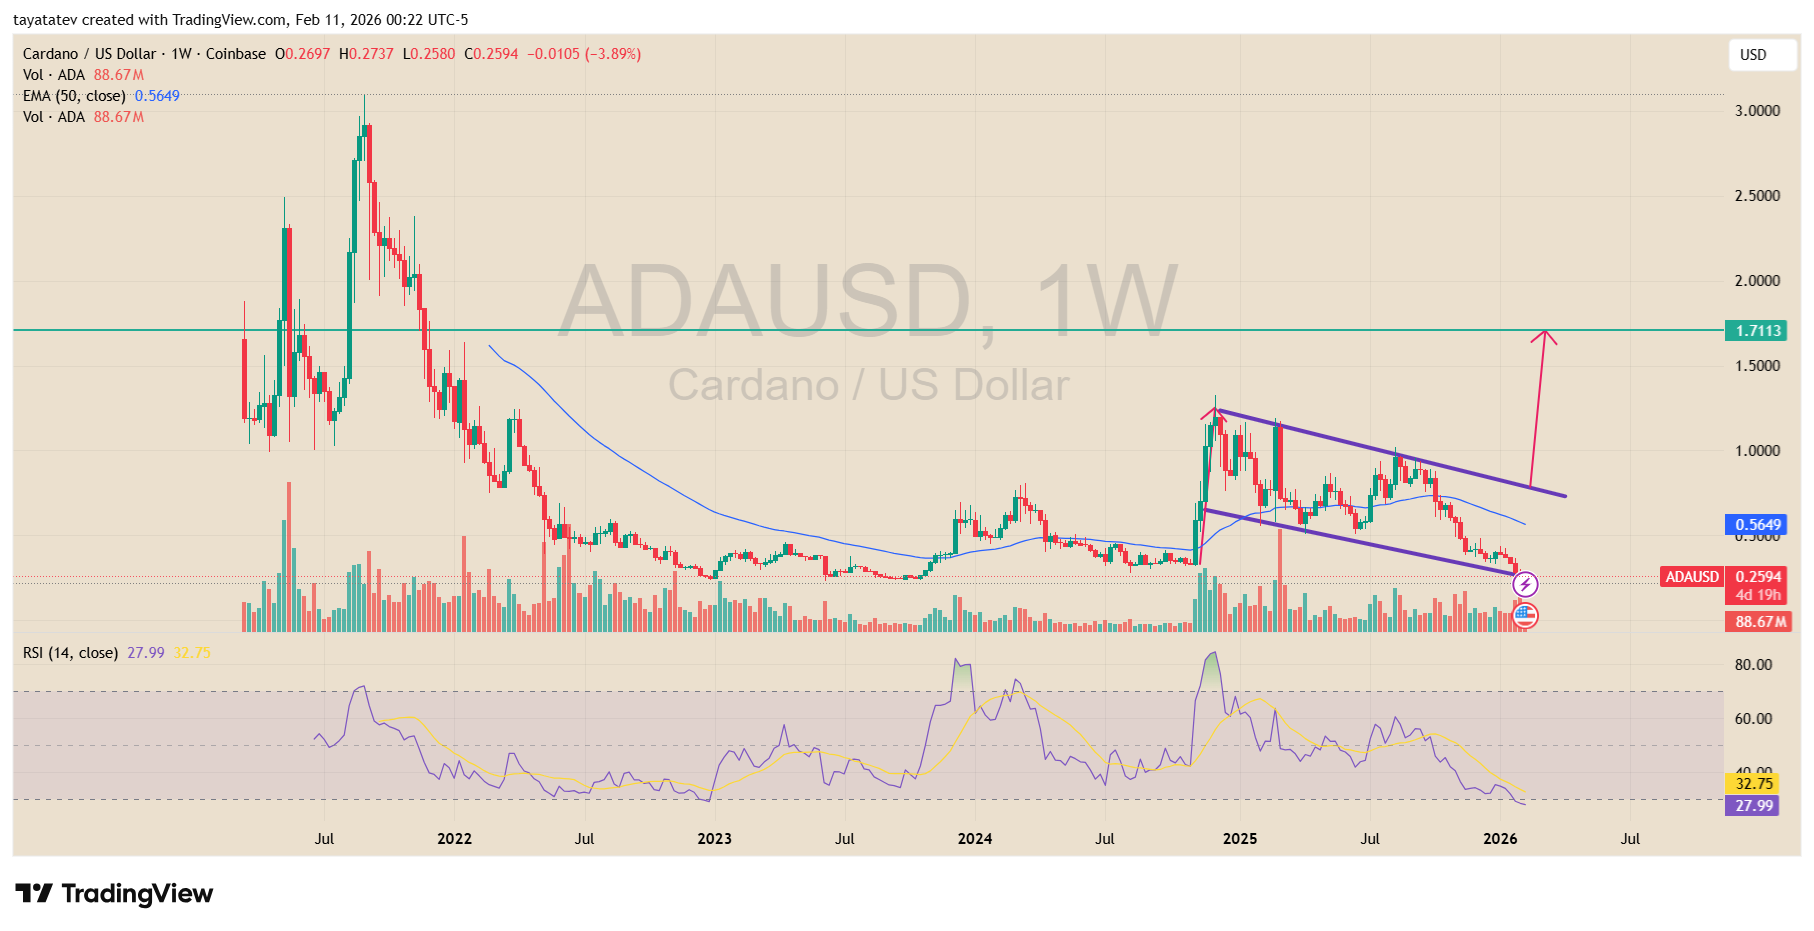
Cardano’s ADA traded near $0.26 on the weekly ADA/USD chart after sliding into the lower boundary of a downward channel, according to a TradingView snapshot dated Feb. 11.
The chart shows price compressing inside a declining range after a prior surge, and therefore technicians frame the structure as a bullish flag in development.
A bullish flag usually forms after a sharp rally, then price drifts lower in a tight, downward-sloping channel.
That pullback signals consolidation, not a full trend reversal, because sellers push price down gradually while buyers defend key levels. As a result, traders watch for a break above the flag’s upper trendline to confirm continuation.
In the snapshot, ADA stays below the 50 week EMA near $0.56, so that level still acts as overhead pressure.
Meanwhile, RSI (14) sits near 28, which puts momentum in oversold territory and shows heavy downside pressure.
However, oversold readings often appear during late stage compression inside continuation patterns.
If ADA breaks above the flag and holds the move on a weekly close, the measured move method projects the next target using the height of the prior impulse.
On this chart, that projection points to about $1.71. From roughly $0.26, that implies a potential gain near 564%, but the target applies only if the breakout confirms and price maintains strength above the channel.
Stay ahead in the crypto world – follow us on X for the latest updates, insights, and trends!🚀
Cardano’s Past Bull Runs Show Fading Upside as Analyst Compares Cycle Performance
Cardano posted sharply different returns across recent market cycles, according to a TradingView chart shared by X user Degen Hardy on Feb. 10.
The chart tracks ADA’s long-term price history and highlights two major expansion phases. In the prior cycle, ADA surged more than 17,400% from its base to the peak.
By contrast, the current cycle’s advance topped out above 500% before momentum slowed.
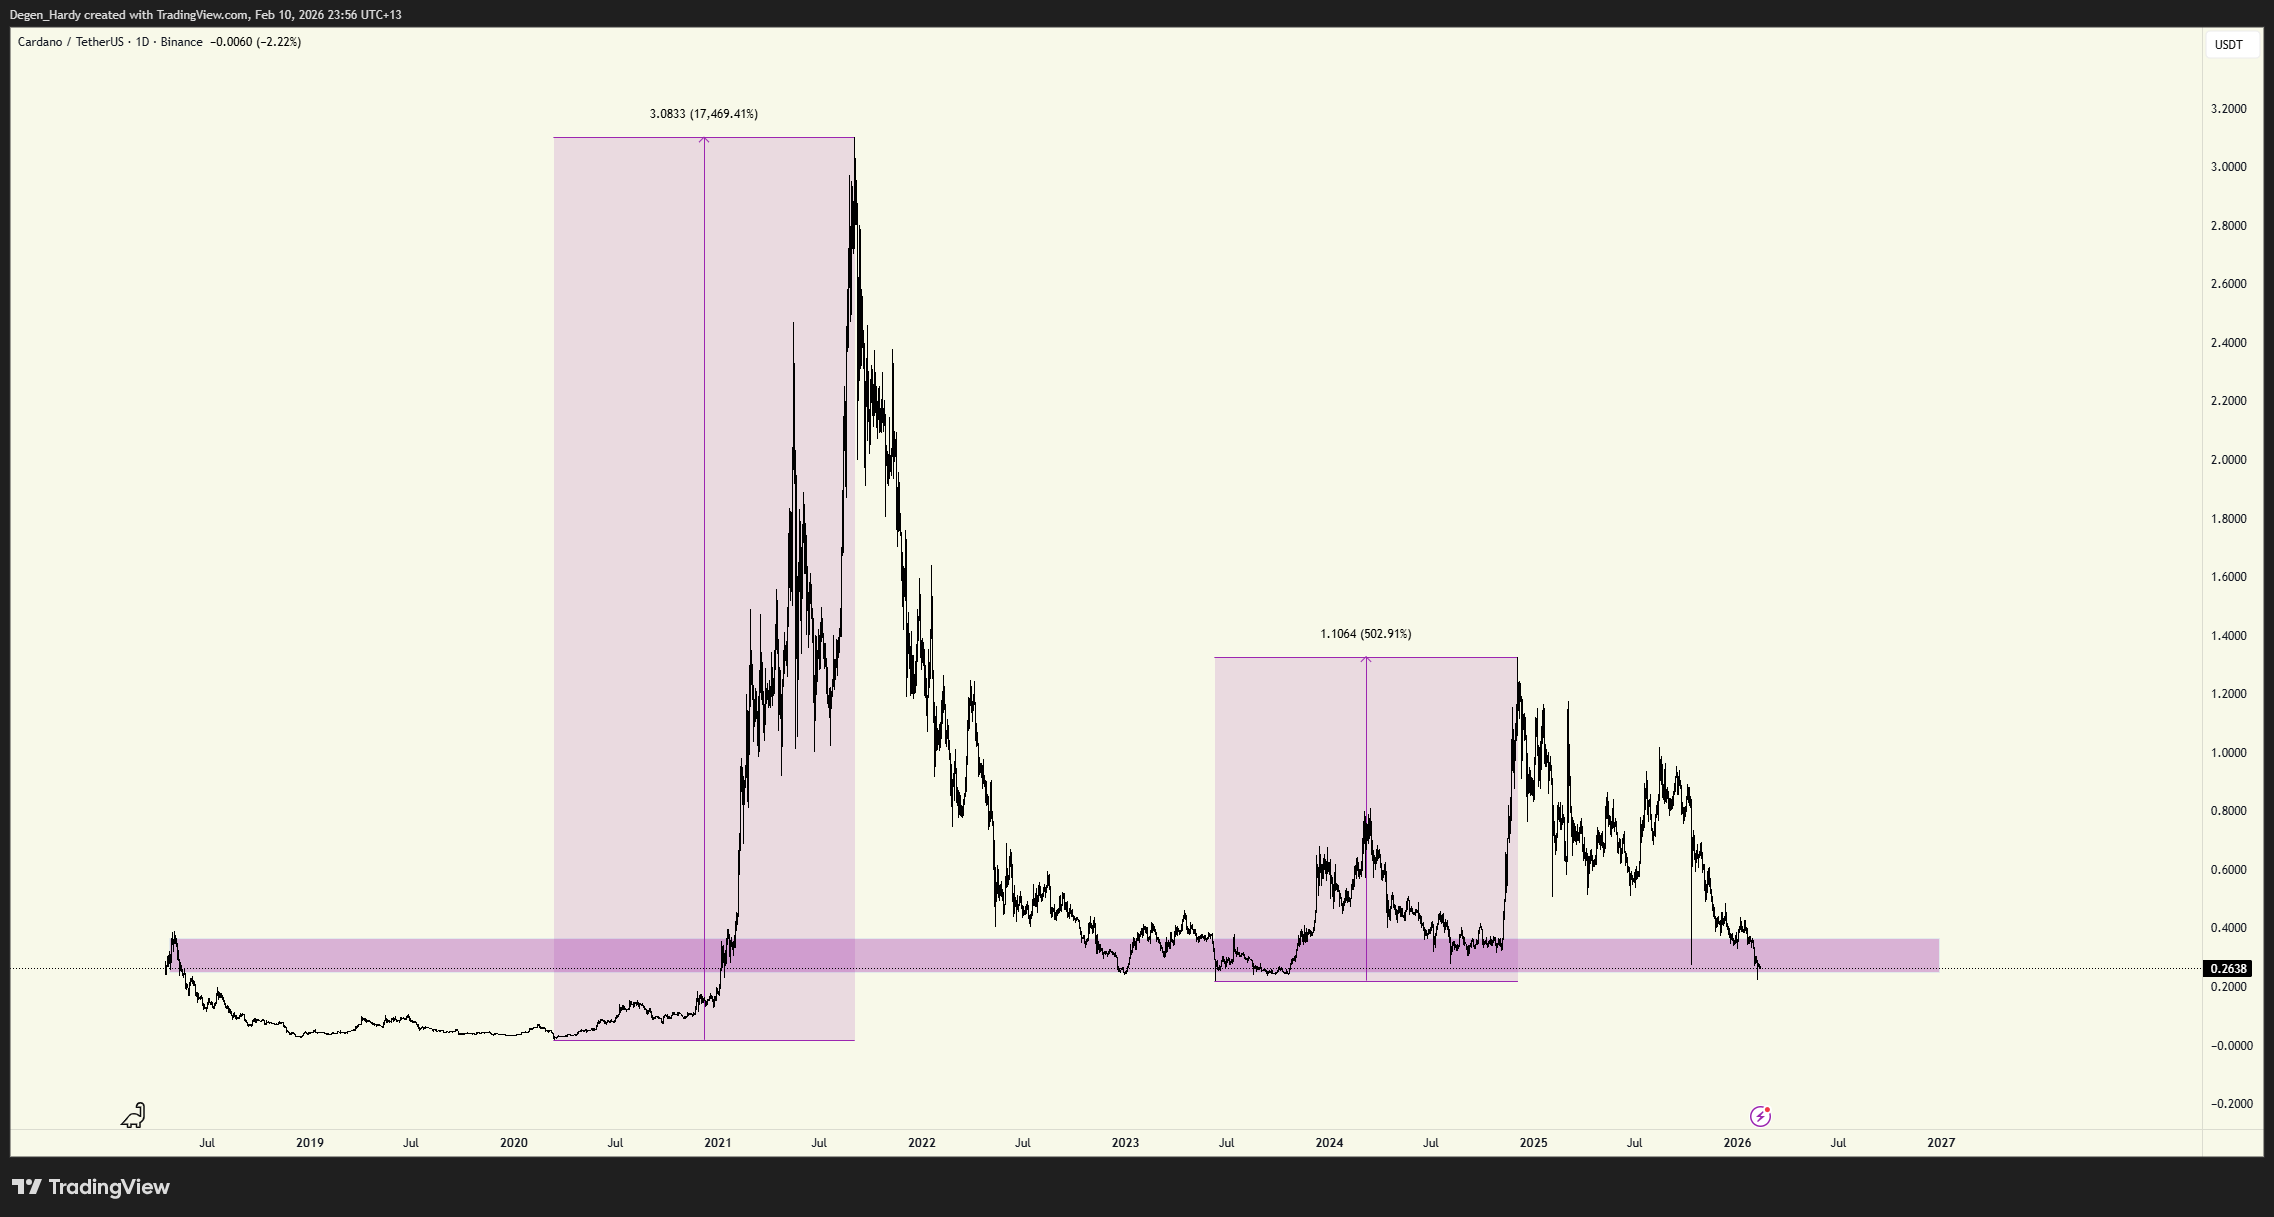
The comparison shows how ADA’s upside compressed between cycles. In the earlier rally, price broke from a long accumulation zone and then accelerated in a near-vertical move.
After that peak, the market entered a prolonged decline that erased most of the gains.
In the following cycle, price again lifted from a base, yet the expansion reached a lower multiple than before. As a result, the data points to diminishing returns across successive bull phases.
At the same time, the chart marks recurring base zones where price spent extended periods before expansion.
Those ranges acted as launch areas for both rallies. However, the second expansion covered a smaller vertical distance, which reflects tighter upside relative to the prior cycle.
Therefore, the structure shows that historical performance alone does not repeat at the same scale across cycles.
Hardy raised the broader question of whether alternative cryptocurrencies can still extend gains late in the cycle or whether outsized moves now require a fresh market phase.
The chart does not answer that question directly. Instead, it shows how past cycles delivered progressively smaller percentage advances for Cardano, even when breakouts formed from similar base structures.
Disclosure:This article does not contain investment advice or recommendations. Every investment and trading move involves risk, and readers should conduct their own research when making a decision.
Kriptoworld.com accepts no liability for any errors in the articles or for any financial loss resulting from incorrect information.

Tatevik Avetisyan is an editor at Kriptoworld who covers emerging crypto trends, blockchain innovation, and altcoin developments. She is passionate about breaking down complex stories for a global audience and making digital finance more accessible.
📅 Published: February 11, 2026 • 🕓 Last updated: February 11, 2026
