


Bitcoin slid hard on the daily chart and then staged a small rebound, according to a TradingView snapshot shared by X. BTCUSD fell through a descending channel and key horizontal levels before bouncing from the low-$70,000s on Bitstamp.
At the time of the chart, price traded near $70,841 after printing a session range between about $70,031 and $71,383.
Stay ahead in the crypto world – follow us on X for the latest updates, insights, and trends!🚀
The move followed several weeks of lower highs and lower lows, and therefore kept the broader structure tilted to the downside.
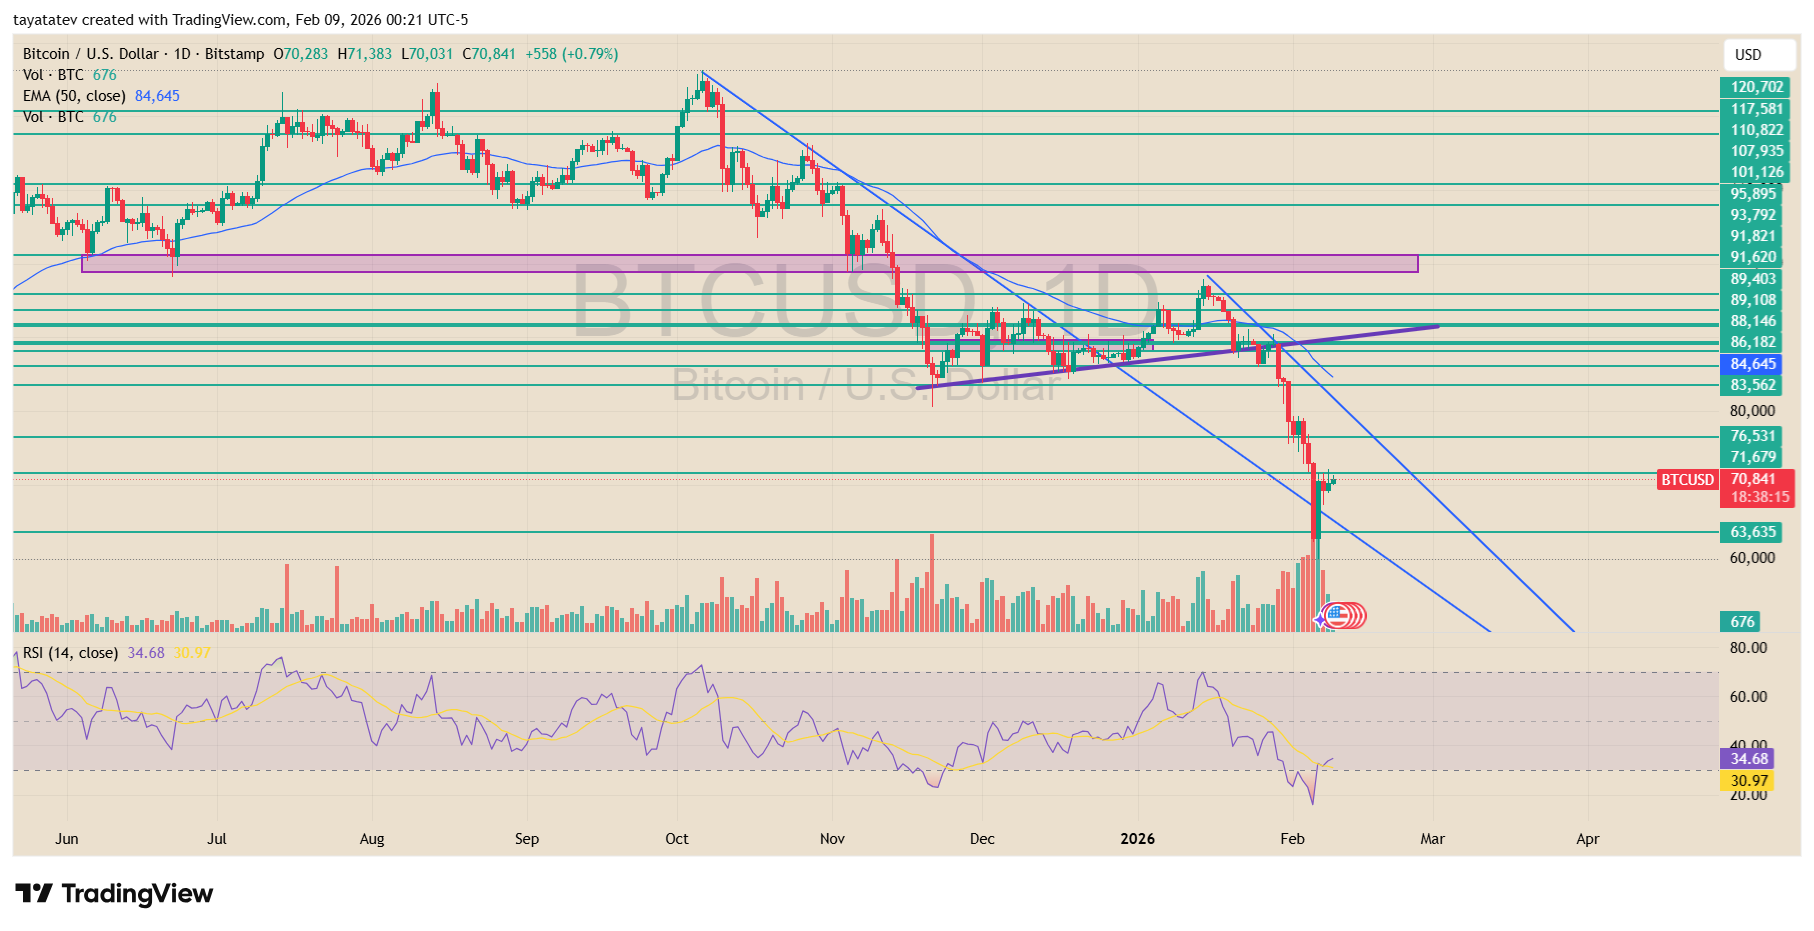
At the same time, Bitcoin lost the 50-day exponential moving average near $84,645, which had already flipped into overhead resistance. Price also broke under the rising short-term trendline that had supported consolidation through late January.
As a result, sellers pushed price into a prior demand zone marked in the low-$70,000s.
The rebound that followed lifted price back above the immediate intraday low, yet it remained well below the former support band around the mid-$80,000s, which now acts as resistance.
Volume expanded during the selloff and spiked on the rebound candle, which points to forced downside followed by fast dip buying. Meanwhile, the relative strength index on the daily chart dropped toward the low-30s and then curled higher.
That shift shows short-term selling pressure easing after the flush. Even so, RSI stayed below the 50 line, and therefore momentum remained weak on a trend basis.
Key horizontal levels sit overhead near $76,531 and $83,562, where prior reactions clustered during the breakdown.
Below spot, the chart marks deeper levels around $63,635, which line up with earlier consolidation zones from mid-2025.
Until price reclaims the former support area near the mid-$80,000s and holds above the 50-day EMA, the structure continues to reflect trend pressure to the downside despite the near-term bounce.
Bitcoin RSI Breakdown Marks End of 12-Month Pullback on Monthly Chart
Bitcoin’s monthly chart shows a long pullback phase that followed prior impulsive moves, according to a TradingView graphic shared by trader Trader Tardigrade on X.
The chart maps two major uptrend legs, each followed by a deep correction that lasted about 12 monthly candles.
In both cases, the pullback phase aligned with a breakdown in the relative strength index trendline, which marked the transition from impulse to correction within the broader uptrend structure.
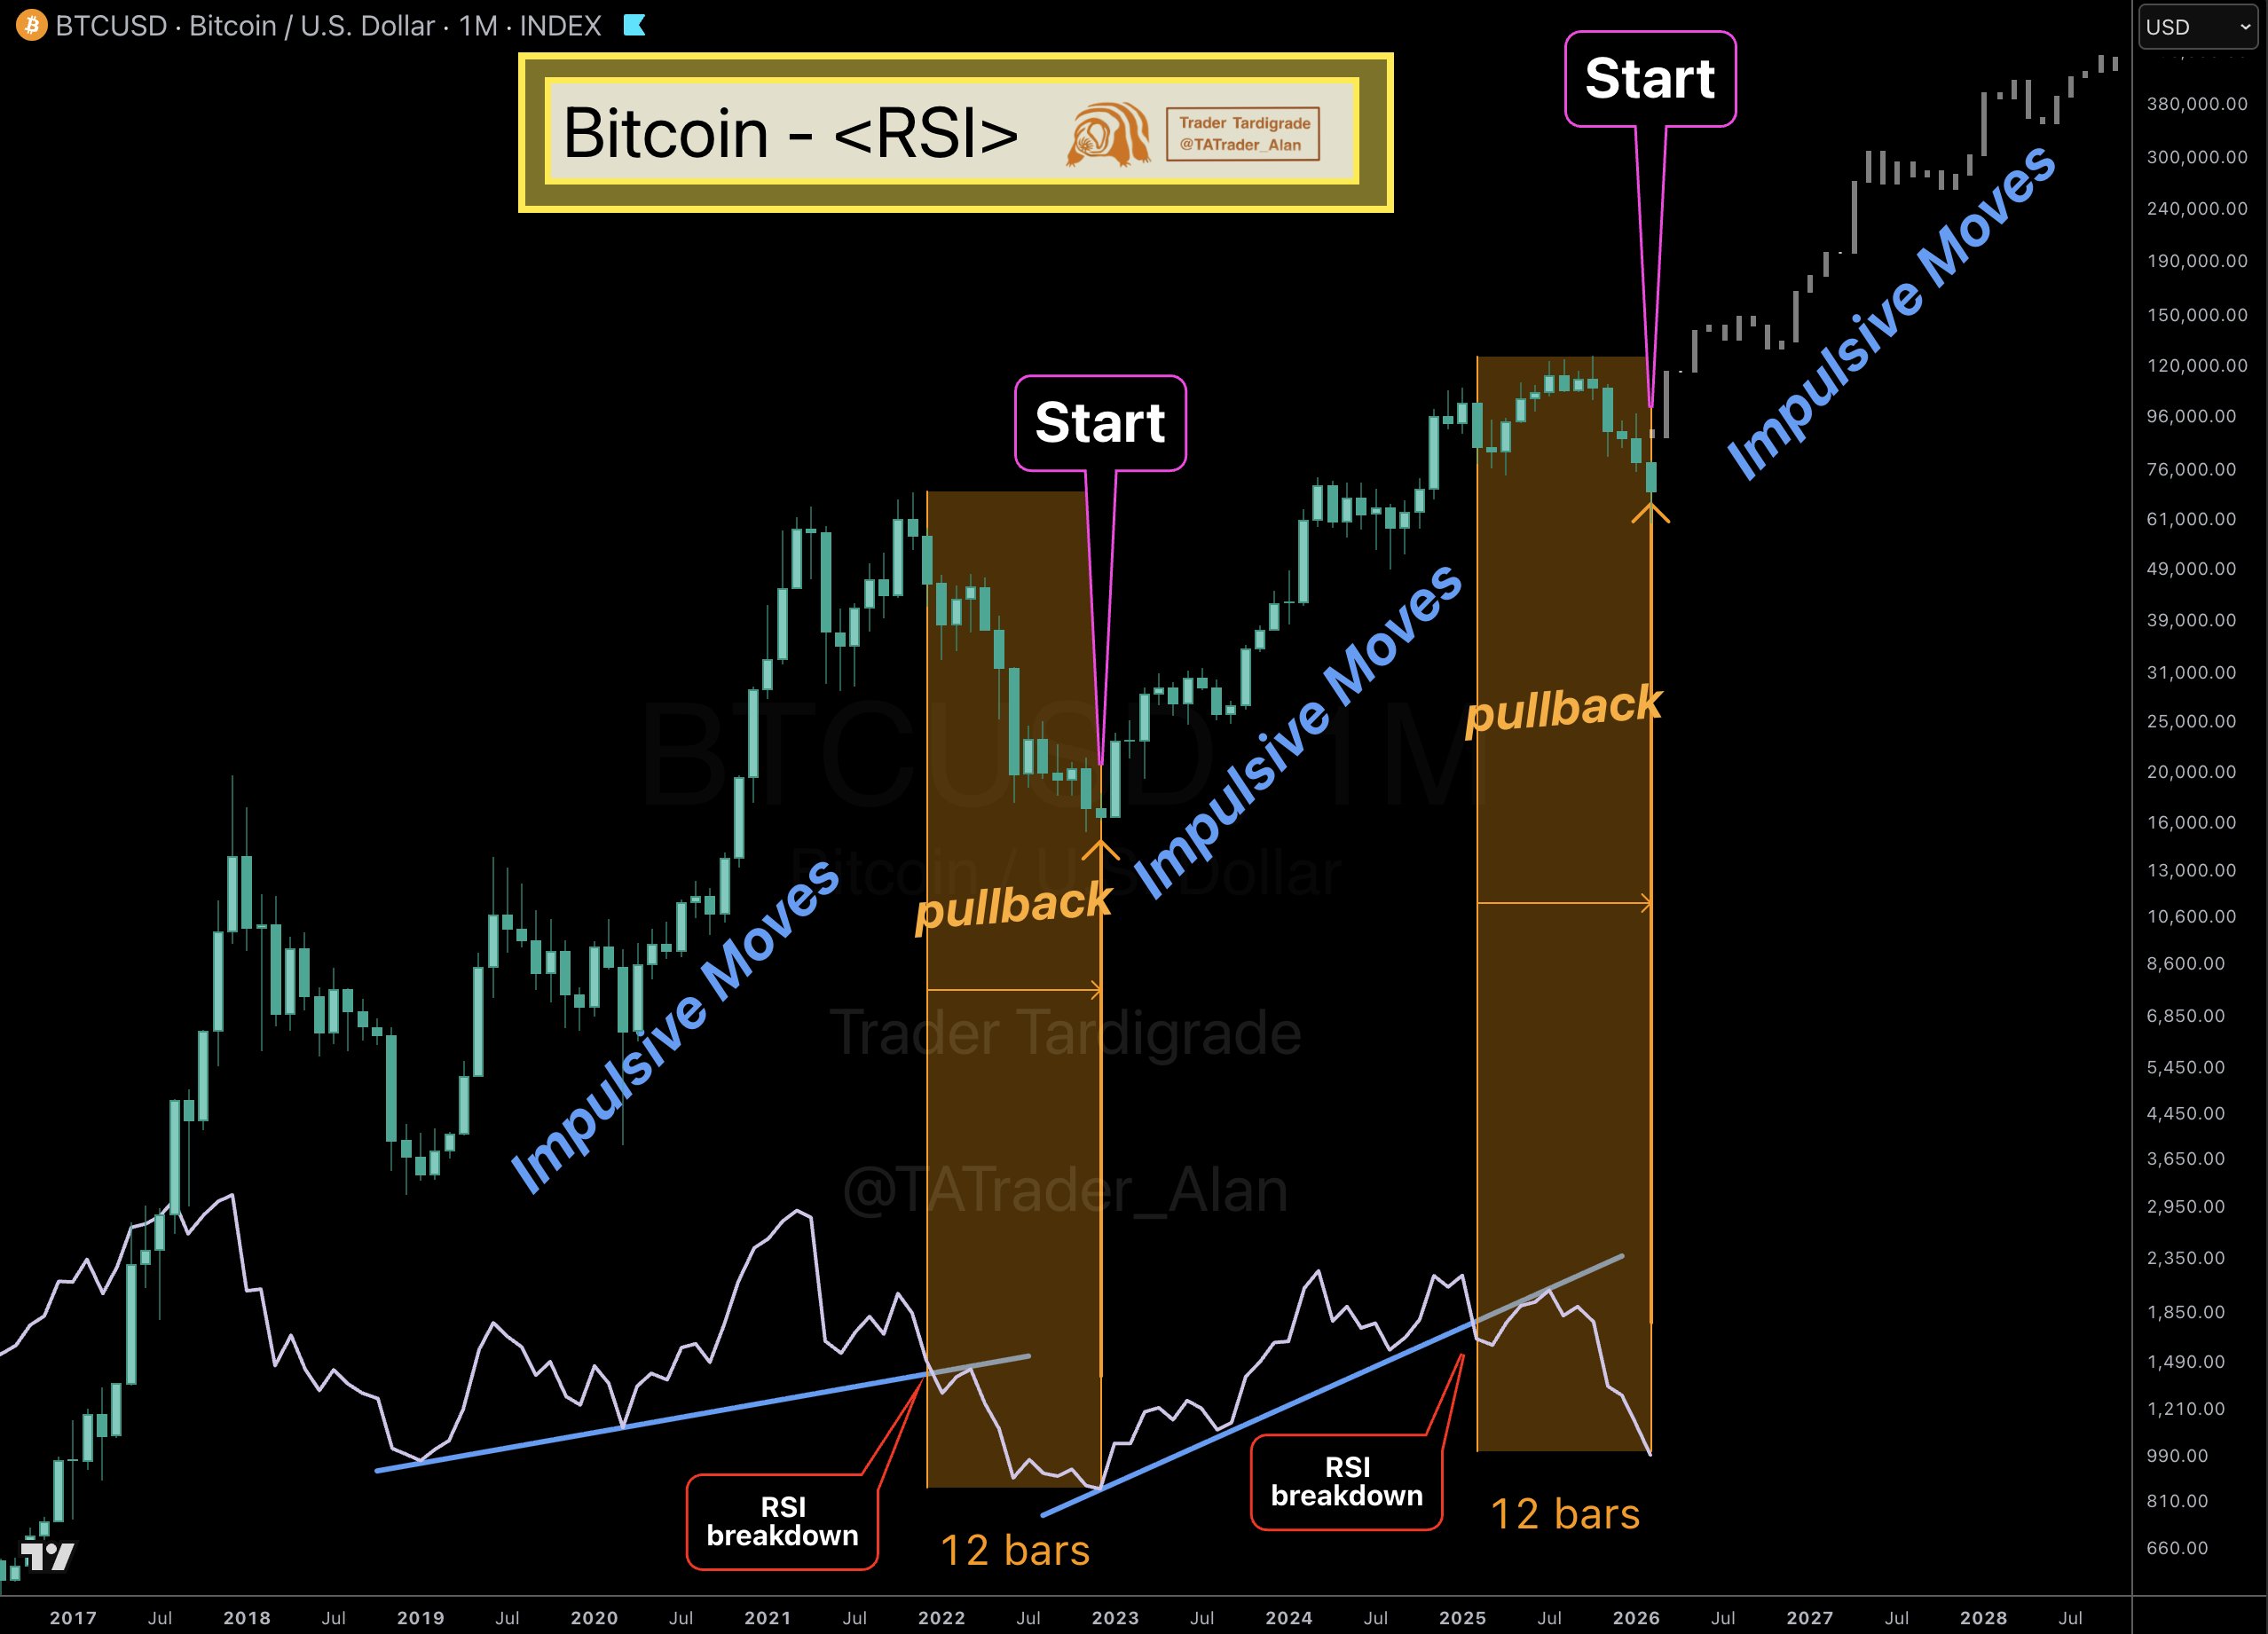
In the first cycle, Bitcoin printed a strong impulsive move higher, then rolled into a prolonged retracement zone that lasted roughly one year.
During that period, RSI broke below its rising support line and stayed weak until price stabilized.
Once RSI turned back up, price shifted from corrective behavior into a fresh impulsive advance. The chart labels this shift as the “start” of the next trend leg after the 12-bar pullback phase completed.
The current cycle shows a similar sequence. Bitcoin posted another strong impulsive advance and then entered a 12-month pullback window, marked by a breakdown in monthly RSI.
Price moved sideways to lower during that stretch while RSI tracked under a rising guide line.
As of the latest candle, the pullback box ends, and the RSI breakdown phase appears complete within the same time span seen in the prior cycle.
As a result, the structure now mirrors the earlier transition point that preceded the last major advance.
The chart frames the recent period as the end of the corrective phase, with the next impulsive move positioned to begin if the historical rhythm holds.
While the setup reflects a pattern-based comparison across cycles, price remains within the broader monthly trend context, and confirmation depends on follow-through in subsequent candles.
Disclosure:This article does not contain investment advice or recommendations. Every investment and trading move involves risk, and readers should conduct their own research when making a decision.
Kriptoworld.com accepts no liability for any errors in the articles or for any financial loss resulting from incorrect information.

Tatevik Avetisyan is an editor at Kriptoworld who covers emerging crypto trends, blockchain innovation, and altcoin developments. She is passionate about breaking down complex stories for a global audience and making digital finance more accessible.
📅 Published: February 9, 2026 • 🕓 Last updated: February 9, 2026
