


Cardano ADA trades near 0.423 dollars while its weekly chart shows a clear bullish flag pattern developing after the strong rally earlier this year.
The structure appears as price pulls back inside a downward-sloping channel, with lower highs and lower lows forming in tight succession.
Stay ahead in the crypto world – follow us on X for the latest updates, insights, and trends!🚀
Yet the broader trend that led into this channel remains upward, which is why the market treats the formation as a continuation setup rather than a reversal signal.

A bullish flag pattern forms when price surges sharply, then consolidates inside a narrow channel that tilts against the prior trend.
The consolidation shows temporary exhaustion, but the pattern favors another strong move when buyers regain control and push price above the flag’s upper boundary.
In this case, ADA’s rally toward the spring 2025 peak created the “flagpole,” and the multi-month drift lower built the “flag.”
If ADA confirms a breakout above the upper trendline, the measured move of the pattern points to a gain of roughly 303 percent from current levels.
That projection places the potential target around 1.71 dollars, which aligns with the horizontal resistance drawn on the chart.
Volume behavior supports the setup as trading activity has eased during the consolidation, which often precedes expansion when a breakout forms.
ADA now trades below the 50-week EMA at 0.665 dollars, but the indicator sits inside the flag and does not invalidate the structure.
Momentum signals remain subdued, with RSI near 34, yet weekly RSI often lags during compression phases and typically turns only when price breaks out.
Until that move occurs, ADA stays inside the consolidation range, though the technical pattern maintains its bullish bias.
The final signal rests on a weekly close through the flag’s upper boundary. A clean breakout would confirm the continuation pattern and establish the 1.71-dollar zone as the next major objective.
ADA Holds Long-Term Support as Weekly Chart Points to a Possible Recovery Move
Cardano weekly chart shows price rebounding from a long-term ascending trendline that has held multiple times since 2023.
Each touch on this line triggered a reaction from buyers, and the latest bounce follows the same pattern.
The structure keeps ADA within its broader upward trajectory even after the sharp pullback seen this year.
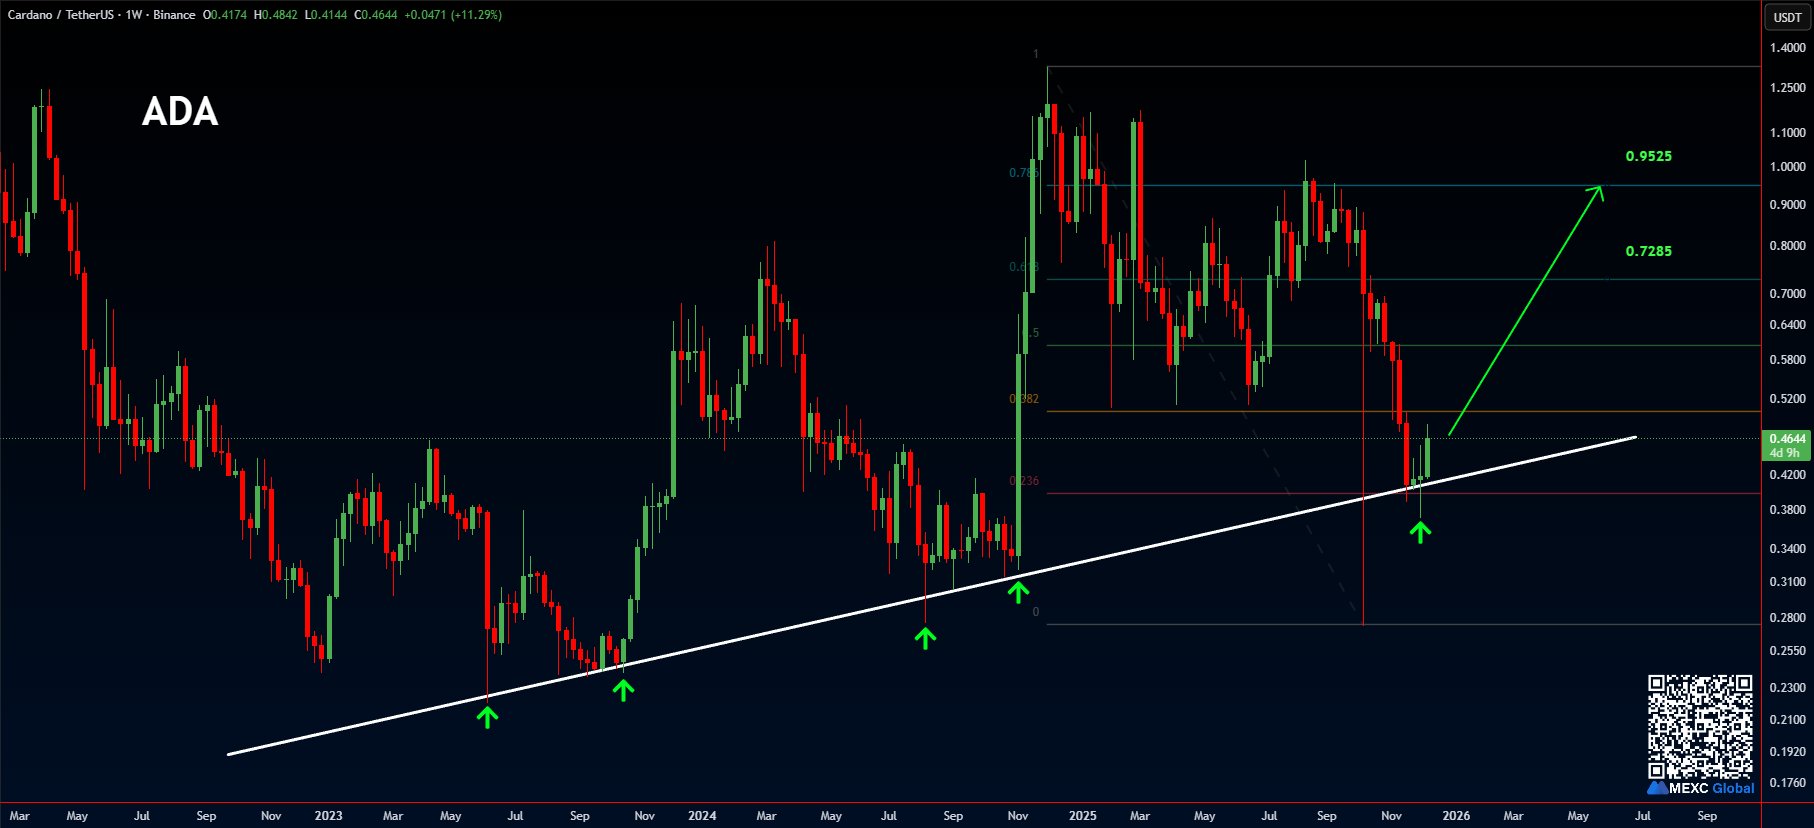
The chart also highlights Fibonacci retracement levels from the prior rally. ADA now sits between the 0.382 and 0.236 zones, which often act as early turning points when markets attempt to stabilize.
If momentum continues, price has room to approach the 0.7285 level, which marks a key mid-range resistance within the retracement framework.
A sustained weekly close above that area would open the path toward 0.9525, the upper Fibonacci target that aligns with the chart’s projected arrow.
The repeated defense of the rising trendline adds weight to the bounce narrative. Buyers stepped in at the same dynamic support seen in mid-2023, late-2023, and earlier in 2024, showing consistent demand along that diagonal.
This reaction came after heavy selling pressure, yet the trendline held once again, which keeps ADA inside its multi-year structure rather than shifting into a broader downtrend.
For now, ADA trades above the trendline with improving candle structure, and the technical map remains straightforward: hold the trendline to maintain the recovery setup, target 0.7285 as the next major test, and watch 0.9525 as the upper objective if strength persists.
Disclosure:This article does not contain investment advice or recommendations. Every investment and trading move involves risk, and readers should conduct their own research when making a decision.
Kriptoworld.com accepts no liability for any errors in the articles or for any financial loss resulting from incorrect information.

Tatevik Avetisyan is an editor at Kriptoworld who covers emerging crypto trends, blockchain innovation, and altcoin developments. She is passionate about breaking down complex stories for a global audience and making digital finance more accessible.
📅 Published: December 11, 2025 • 🕓 Last updated: December 11, 2025
