


Ethereum spot ETFs in the United States logged about $184.2 million in net outflows on Oct. 30, 2025, the heaviest daily withdrawal in weeks, according to fund flow data shared on X. The move signals a coordinated pullback across issuers.
BlackRock’s ETHA product accounted for the bulk of it, posting about $118 million in redemptions.
Stay ahead in the crypto world – follow us on X for the latest updates, insights, and trends!🚀
That single line item made up more than half of the day’s total exit, showing that one large provider can still swing daily Ethereum ETF flows.
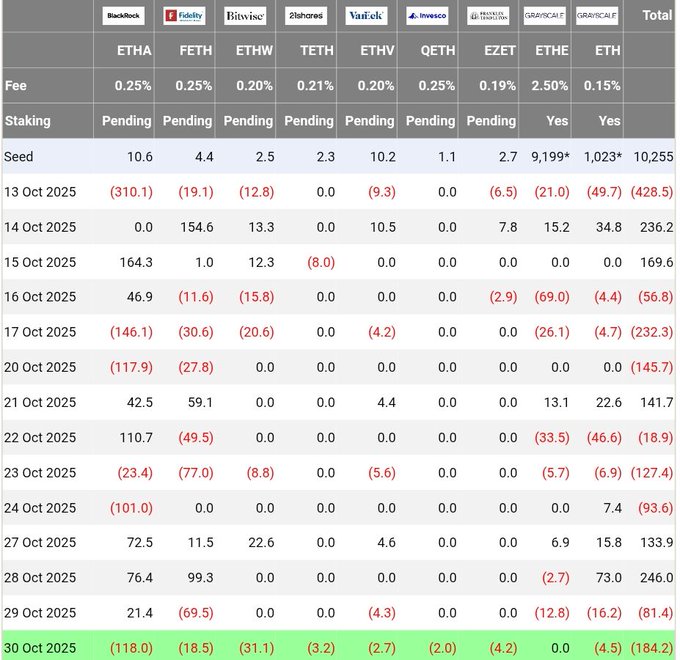
Ethereum Spot ETF Outflow Table, Oct. 13–30, 2025. Source: @TedPillows on X.
Other issuers also bled assets. Fidelity’s FETH saw roughly $18.5 million leave. Bitwise’s ETHW product lost about $31.1 million. VanEck’s TETH recorded a smaller $3.2 million outflow, while Invesco’s ETHV dropped about $2.7 million.
Franklin Templeton’s QETH slipped $2 million, and Grayscale’s newer ether product showed around $4.2 million leaving.
The legacy Grayscale ETHE line showed another $4.5 million out. Together, these redemptions brought the day’s tally to $184.2 million.
The table also shows that Oct. 30 followed several mixed sessions, with some mid-October days showing inflows and others showing sharp selling, especially at BlackRock’s fund.
The latest print, however, was clearly a net-selling day, led by the largest issuer.
Ethereum Mirrors Gold’s Breakout Setup
A chart comparison by analyst @MikybullCrypto shows Ethereum’s current structure closely resembles gold’s 2023 breakout pattern.
On the weekly timeframe, gold broke above a long resistance near $2,000 after forming a descending wedge, then retested it before launching to new highs above $3,000.
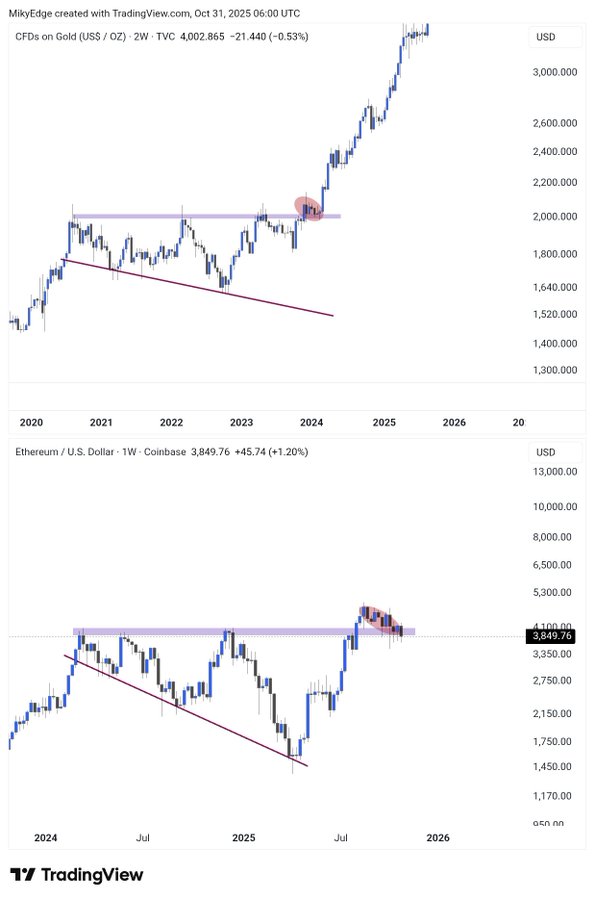
Ethereum’s chart displays a similar setup. The asset broke out from a descending wedge earlier in 2025, then paused below $4,000, forming a narrow consolidation range that mirrors gold’s retest zone.
The structure suggests Ethereum is building strength at former resistance before a possible continuation move.
The parallel implies that if the pattern holds, Ethereum could enter an expansion phase similar to gold’s move post-breakout.
Both charts show long accumulation zones followed by resistance retests, hinting that institutional rotation and ETF inflows could align with the next leg higher.
Ethereum Forms Bullish Flag, Targets 61% Rally on Breakout
Ethereum traded near $3,850 on Oct. 31 while holding inside a downward-sloping channel that looks like a bullish flag on the daily chart.
A bullish flag is a pattern where price makes a strong impulse move up and then cools down inside a tight, falling structure before trying to continue higher.
Here, ETH made the pole in August, then pulled back in a controlled way, staying above the 50-day EMA around $4,090, which shows buyers still defend the trend.
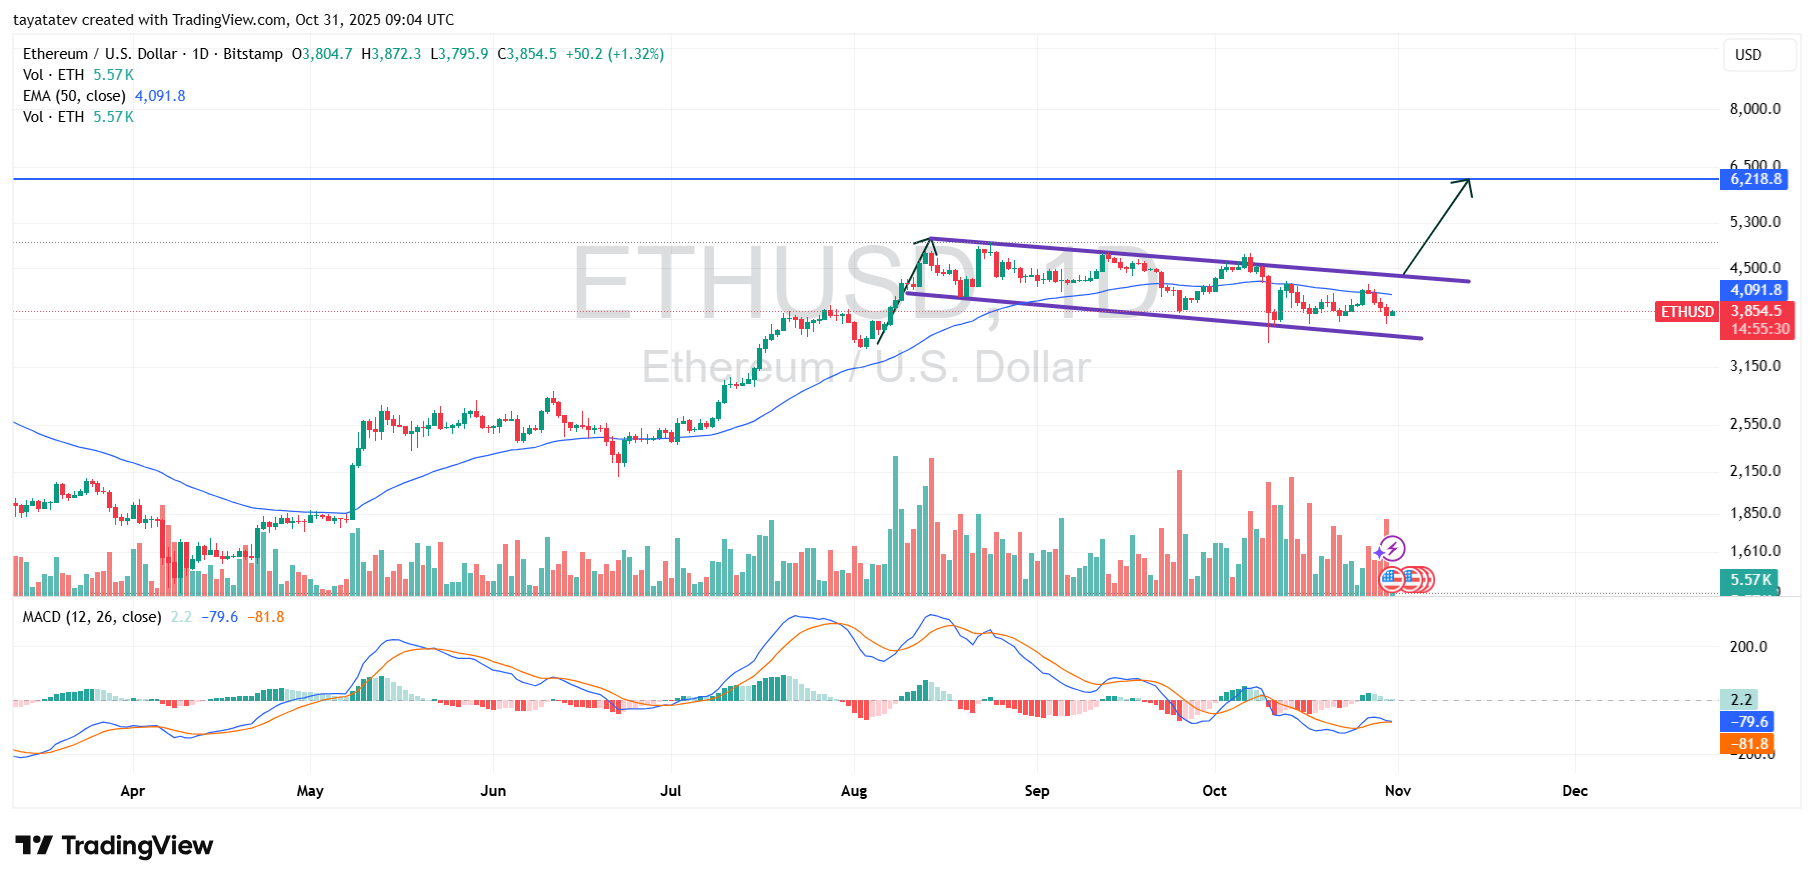
At the same time, the lower purple line under price keeps rising slowly, so sellers are not pushing ETH into a deeper correction.
Volume also declined during the flag, which is typical for this pattern and means the market is waiting for a breakout candle instead of distributing. The MACD at the bottom stays below zero but is flattening, so momentum can return fast if price closes above the flag’s upper line.
If Ethereum confirms the breakout above the flag top, the measured move points to about 61% upside from the current zone, taking price from around $3,850 to roughly $6,200 — the level marked on the chart as the next resistance area.
That target comes from taking the height of the pole and projecting it from the breakout point.
Until that breakout happens, ETH is still inside the flag, but the structure favors continuation, not reversal.
Disclosure:This article does not contain investment advice or recommendations. Every investment and trading move involves risk, and readers should conduct their own research when making a decision.
Kriptoworld.com accepts no liability for any errors in the articles or for any financial loss resulting from incorrect information.

Tatevik Avetisyan is an editor at Kriptoworld who covers emerging crypto trends, blockchain innovation, and altcoin developments. She is passionate about breaking down complex stories for a global audience and making digital finance more accessible.
📅 Published: October 31, 2025 • 🕓 Last updated: October 31, 2025
