


Dogecoin is on the move again, and it surged past the $0.180 mark against the US Dollar, and if it can break through the $0.220 resistance, we might see even more gains. Woof!
Dogecoin isn’t joking
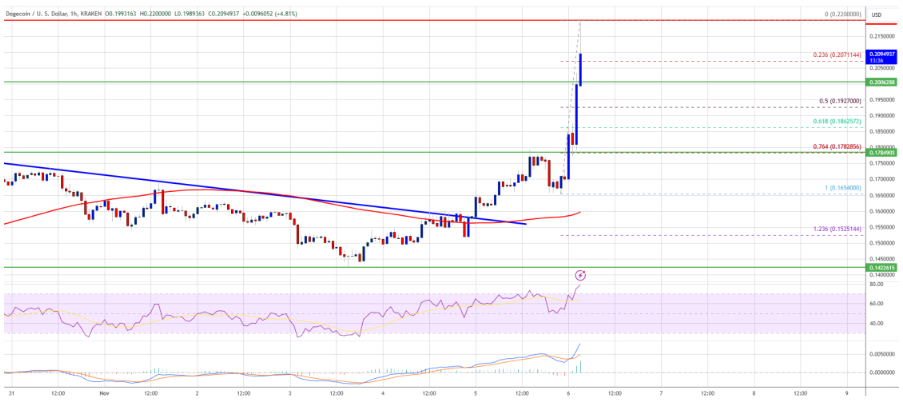
After reclaiming the $0.1650 resistance level, Dogecoin gained momentum, similar to what we’ve seen with Bitcoin and Ethereum.
It managed to push through both the $0.1800, then $0.1850 resistance levels, signaling a strong upside trend.
On the TradingView, a trader known as Aayushjindal shared the analysis about what can we expect in case of the DOGE now.
On the hourly chart for the DOGE/USD pair, there was a significant break above a bearish trend line that had been holding it back at $0.1620.
The price even went above $0.200, reaching a high of $0.2200 before consolidating above the 23.6% Fibonacci retracement level from its recent low of $0.1654.
in the time of writing, Dogecoin is trading slightly below the $0.200 level and is sitting quite comfortably above the 100-hour simple moving average. The immediate resistance to watch is around $0.2150, with the next major hurdle at $0.220.
What’s next for Dogecoin?
Analysts think that if Dogecoin can close above that $0.220 resistance, we could see it push towards $0.2320 and possibly even hit $0.2420 next. For those bullish on DOGE, the ultimate goal might be reaching the $0.250.
But as always, not everything is smooth sailing! If DOGE struggles to rise above $0.2150, it might start to slide back down.
Initial support is expected around $0.2080, with a more significant support level near $0.1920, which aligns with the 50% Fibonacci retracement from its recent price movement.
The main support level to keep an eye on is at $0.1780. If it dips below this point, we hope it’s not, but if it does, we could see prices fall further down to around $0.1650 or even back to $0.1620 in the short term.
What does the indicators say?
Looking at some technical indicators, the hourly MACD for DOGE/USD is gaining momentum in bearish territory, while the RSI is hovering above 50, this is likely means that there’s still some strength in this rally.
In summary, major support levels are at $0.2080 and $0.1920, while key resistance levels are at $0.2150 and $0.2200.
