


Dogecoin’s chart, created on December 10, 2025, shows price trading near 0.146 dollars while it moves inside a clear bearish flag.
The structure formed after the sharp drop in early October, when a long red candle pushed DOGE below the 50-day exponential moving average.
Stay ahead in the crypto world – follow us on X for the latest updates, insights, and trends!🚀
Since then, price has moved inside a narrow, downward-tilting channel marked by parallel trendlines.
The flag’s upper boundary tracks a steady series of lower highs, while the lower boundary holds a sequence of lower lows with weak bounces.
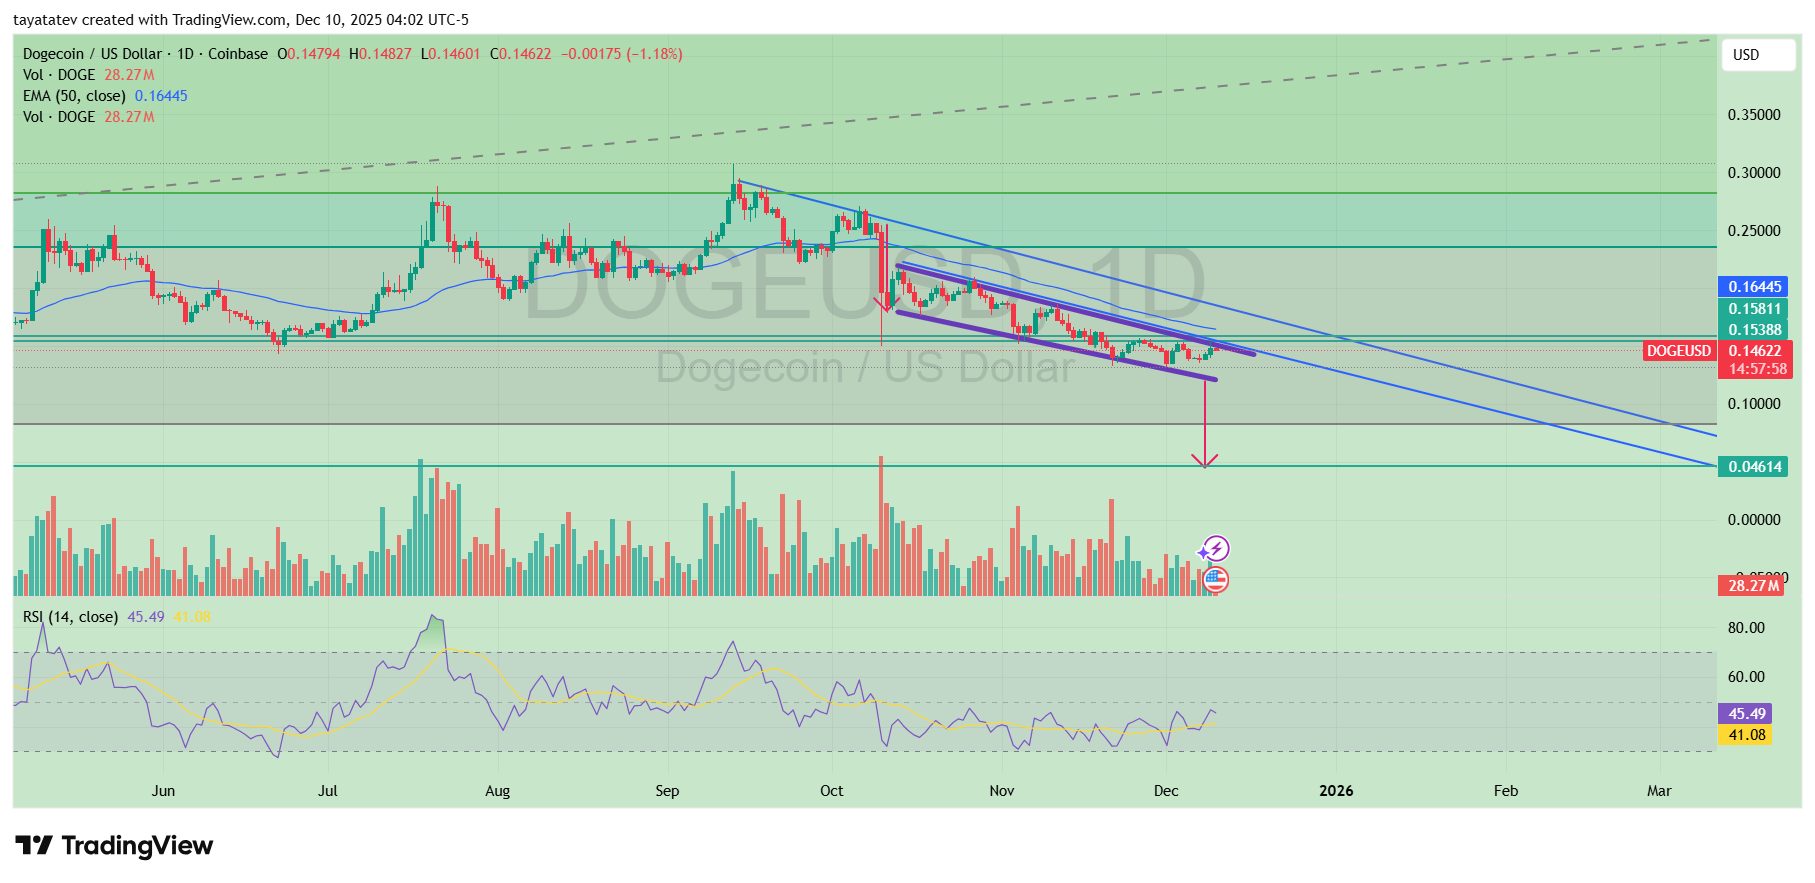
A bearish flag pattern appears after a strong decline and signals continuation when price consolidates in a small, sloping channel before breaking down.
In this chart, the pattern follows the steep fall toward mid-October, which created the “flagpole.”
The channel that developed across October, November, and early December forms the “flag,” with volume trending lower during the consolidation.
This volume behavior fits the pattern’s structure, because bearish flags often show fading activity until the breakout point.
The lower trendline now sits just under the 0.14 dollar area. The projected breakdown target extends from the size of the flagpole.
The pole measures roughly 68 percent when applied to the current price. A confirmed breakdown would therefore point toward the support zone near 0.046 dollars, which appears on the chart as the next major horizontal level.
The chart also shows an arrow pointing directly to that price zone. The target aligns with the flag pattern’s measured-move method, which subtracts the pole’s height from the breakdown level.
RSI trades around 41 and remains below its midline. This RSI position shows weak momentum during the entire consolidation.
DOGE also trades well below the 50-day EMA at 0.164 dollars, which continues to act as dynamic resistance.
Each rally attempt since October stalled under this moving average, reinforcing the downward structure.
Volume spikes occurred only on sell-offs, while recovery periods saw lower activity. This behavior supports continuation rather than reversal.
A breakdown does not guarantee a move to the full target, but the pattern confirms only after price closes decisively below the flag’s lower trendline. Until then, DOGE trades inside the channel.
The structure remains valid while lower highs and lower lows persist and while price stays under the descending resistance line.
Analyst Highlights Dogecoin’s Recurring Multi-Cycle Fractal
Meanwhile, a long-term Dogecoin chart shared by Bitcoinsensus shows three clear market cycles stretching from 2014 through 2025, each defined by the same sequence of deep corrections followed by rapid expansions.
The visual highlights repeating red downtrends, blue accumulation channels, and yellow breakout phases.
The latest cycle appears to mirror the earlier structures, placing DOGE inside a rising channel similar to the 2016 and 2020 periods.
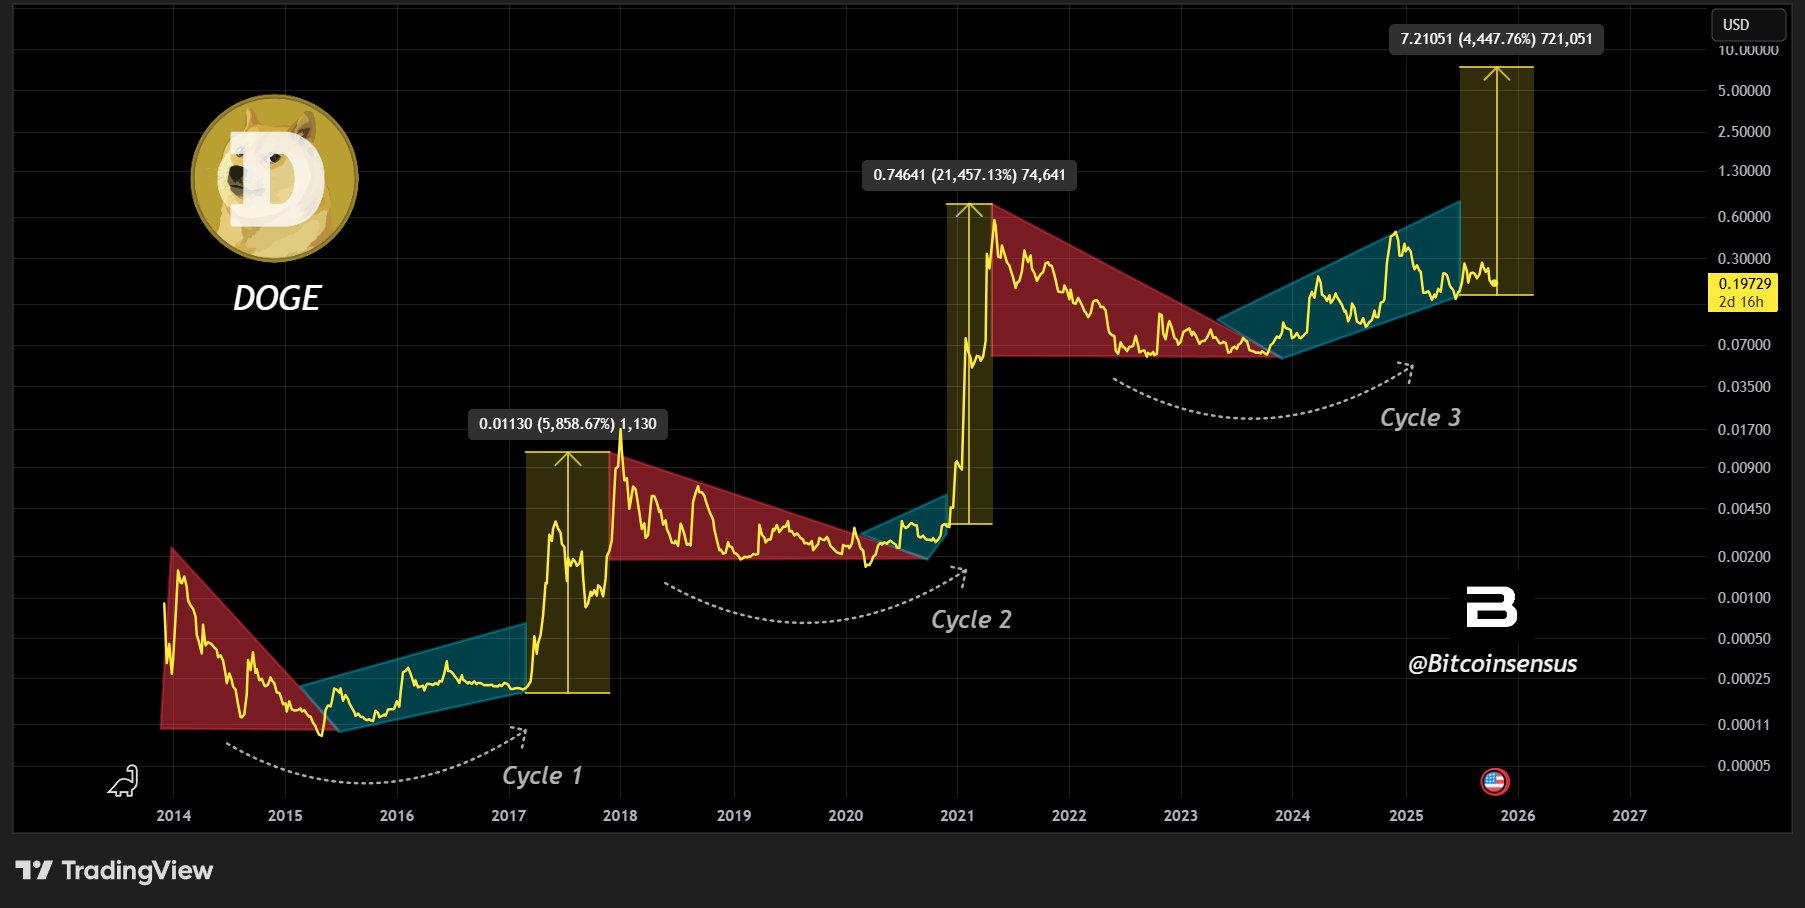
The first cycle from 2014 to 2017 ended with a sharp breakout of roughly 5,800 percent.
The second cycle from 2018 to 2021 produced a larger surge of more than 21,000 percent.
The chart marks these expansions with vertical yellow boxes, showing steep upward movements after long consolidation periods. Each expansion began when price broke above the upper trendline of the blue channel, signaling the start of a new cycle.
The current structure, labeled Cycle 3, follows the same geometry. Dogecoin trades inside a rising channel after a prolonged decline, similar to the earlier accumulation phases.
The fractal projection extends a new yellow box toward the 7 dollar area, reflecting a measured move of about 4,400 percent if the pattern repeats.
Bitcoinsensus argues that the repeating shapes support the idea of another strong impulse, though the chart shows this as a structural comparison rather than a confirmed forecast.
The visual focuses on rhythm and symmetry across cycles, showing how each downturn gave way to multi-year recoveries.
The repeating formations form the basis of the analyst’s view that Dogecoin remains inside a long-term cyclical pattern that has appeared twice before.
Disclosure:This article does not contain investment advice or recommendations. Every investment and trading move involves risk, and readers should conduct their own research when making a decision.
Kriptoworld.com accepts no liability for any errors in the articles or for any financial loss resulting from incorrect information.

Tatevik Avetisyan is an editor at Kriptoworld who covers emerging crypto trends, blockchain innovation, and altcoin developments. She is passionate about breaking down complex stories for a global audience and making digital finance more accessible.
📅 Published: December 10, 2025 • 🕓 Last updated: December 10, 2025
