


Dogecoin fell to fresh short term lows on Thursday as selling pressure pushed price below a key support zone on the 4 hour chart, extending a broader January downtrend.
DOGE traded near $0.114 at the time of the chart capture, down slightly on the session and well below its 50 period exponential moving average.
Stay ahead in the crypto world – follow us on X for the latest updates, insights, and trends!🚀
The move followed a steady sequence of lower highs and lower lows, confirming continued bearish control after several failed recovery attempts earlier in the month.
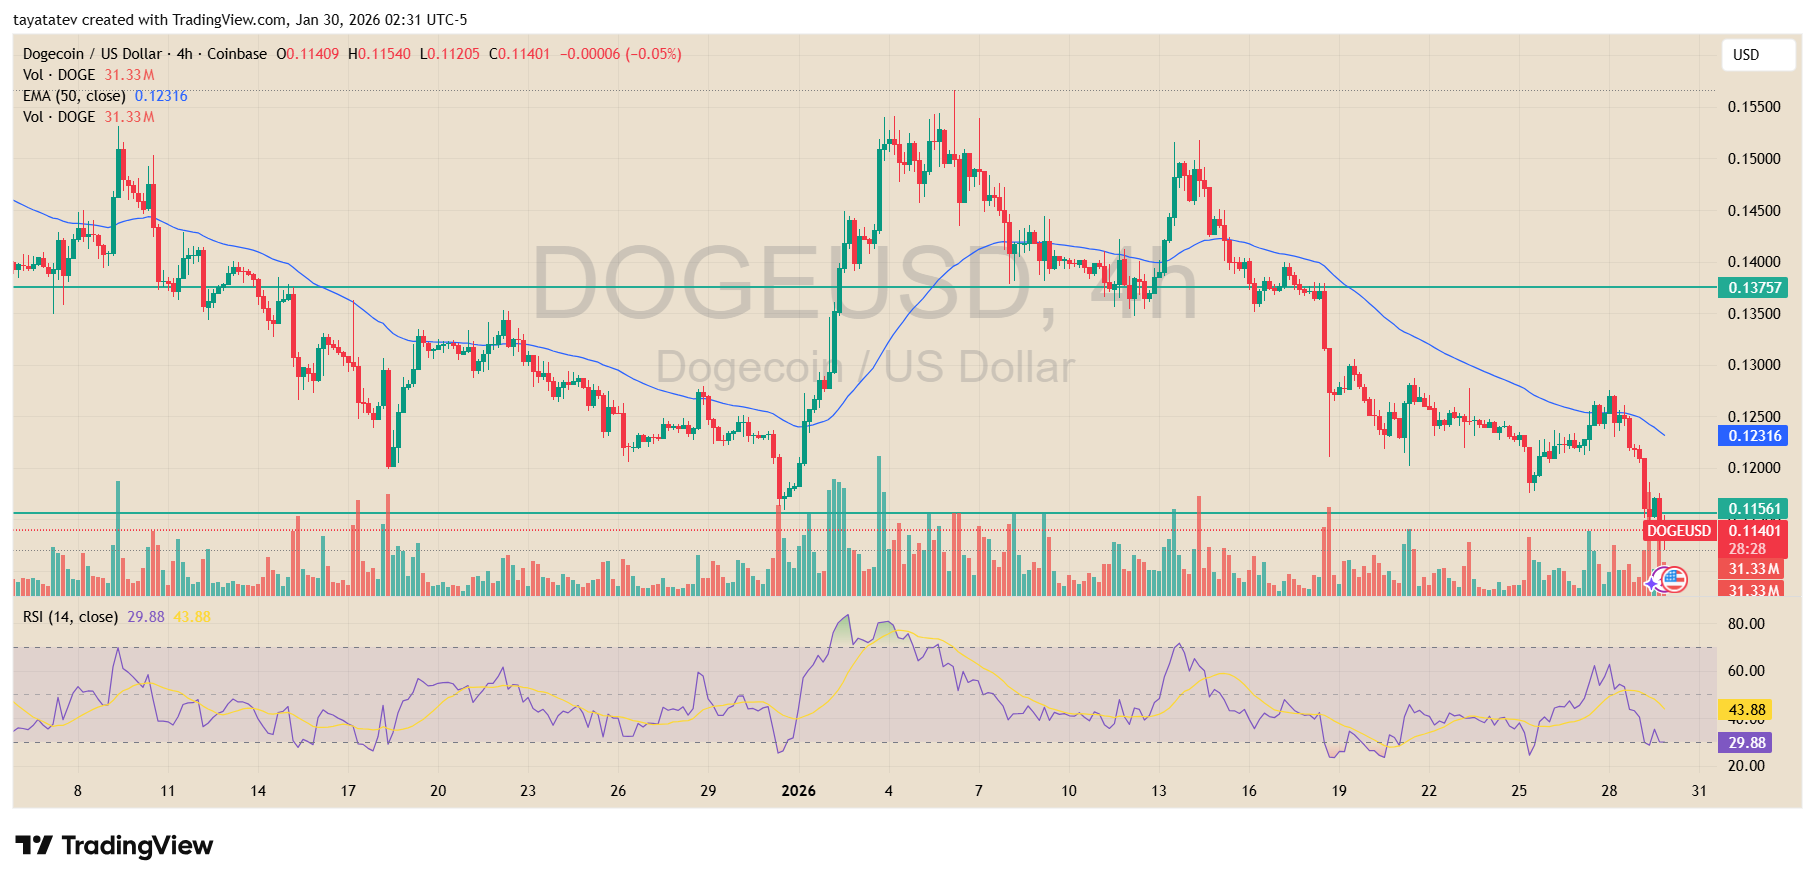
The chart shows Dogecoin breaking below the $0.116 area, a level that previously acted as short term support.
Once that zone failed, price slid quickly toward the $0.112 to $0.113 range, where buyers have started to show limited response. However, the lack of strong rebound candles suggests demand remains weak.
The 50 period EMA, currently near $0.123, continues to slope downward and sits well above price.
That gap highlights how far DOGE has drifted from its short term trend. Each recent bounce has stalled below the EMA, turning it into dynamic resistance rather than support.
Earlier in January, Dogecoin attempted a sharp upside move that briefly pushed price toward the $0.15 area.
That rally failed to hold, and price reversed lower almost immediately. Since then, momentum has steadily faded, and the structure shifted back into a clear downtrend.
Volume data adds to the bearish picture. Selling spikes accompanied the recent breakdown, while rebound attempts occurred on lighter volume. That imbalance suggests sellers remain more aggressive than buyers at current levels.
Momentum indicators also reflect downside pressure. The relative strength index on the 4 hour chart dropped below 30, placing DOGE in oversold territory.
While oversold readings can lead to short term bounces, the RSI has remained weak during the decline, signaling that bearish momentum is still dominant rather than exhausted.
From a structure perspective, the next visible support sits near the psychological $0.11 level.
A clean break below that area would expose the late December consolidation zone near $0.105.
On the upside, DOGE would need to reclaim $0.116 first, then push back above the 50 EMA near $0.123 to signal any meaningful shift in short term trend.
For now, price action shows Dogecoin trading firmly below trend resistance, with momentum and volume aligned to the downside.
Until buyers reclaim broken support levels, the chart continues to favor continuation rather than reversal.
Dogecoin Eyes $0.70 as Analyst Flags Repeating Mini Cycle Pattern
The chart outlines what the analyst described as a series of “mini cycles,” where Dogecoin rallies sharply, taps an upper rising trendline, then enters a prolonged consolidation phase before the next breakout.
This pattern has repeated multiple times since 2023, each time producing progressively larger percentage gains.
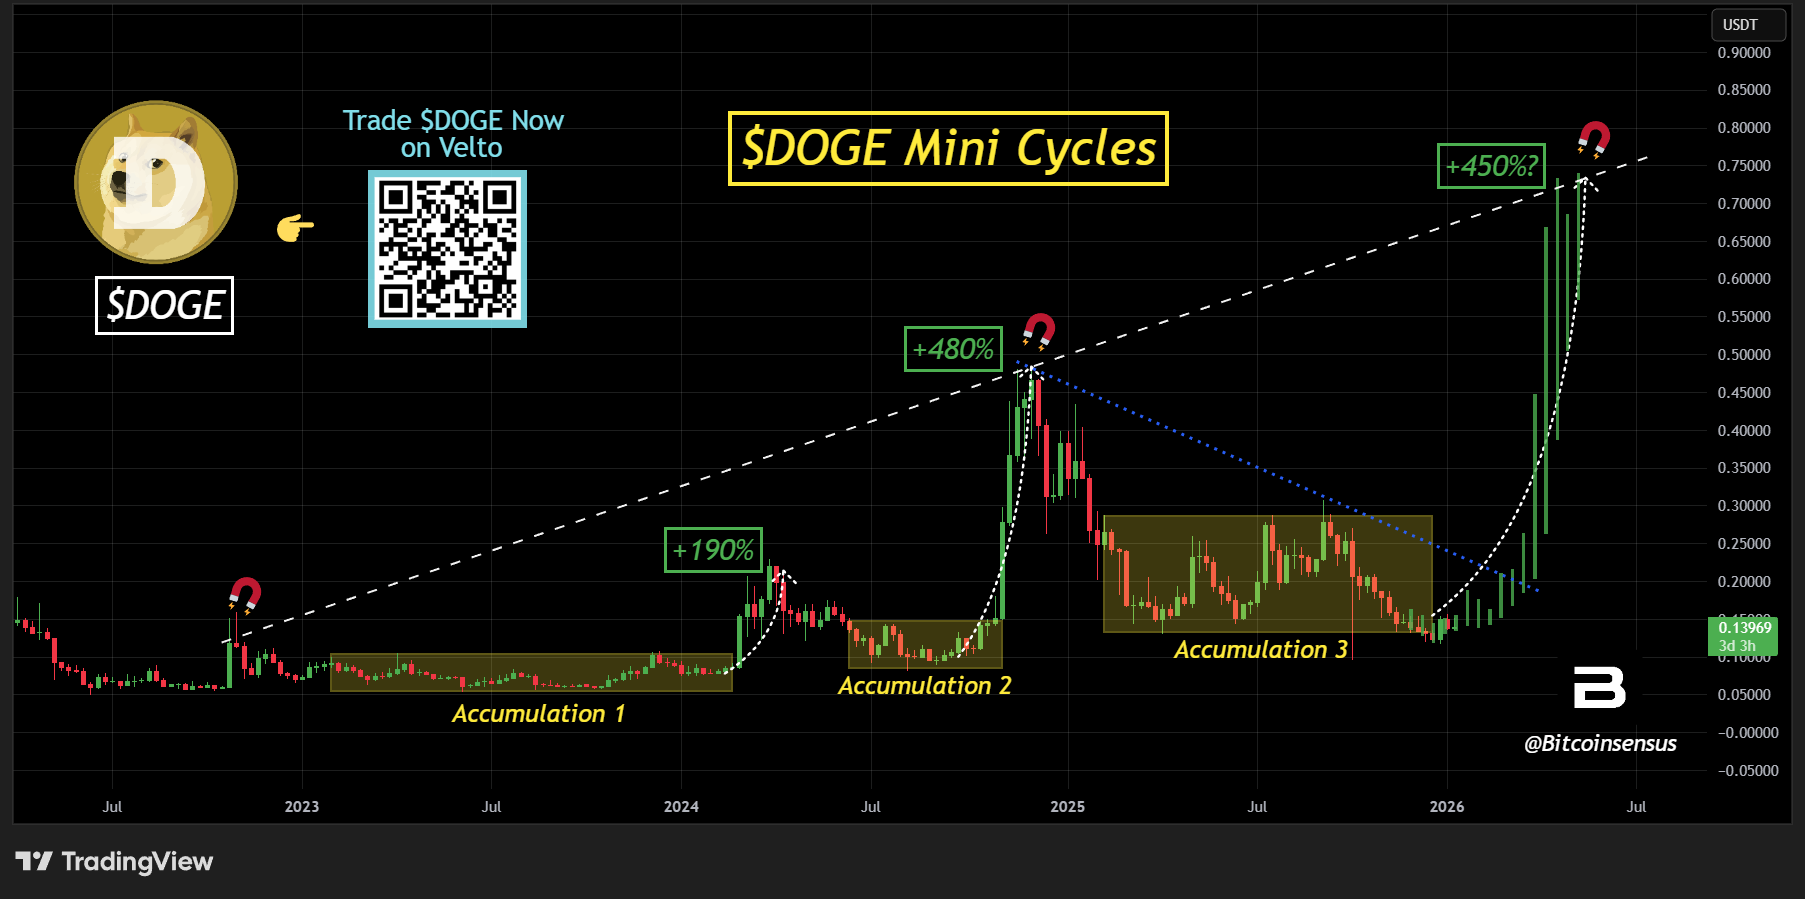
The first accumulation phase in 2023 preceded a rally of roughly 190%, followed by a slow retracement and sideways trading.
A second accumulation phase in 2024 led to a stronger upside move, with price surging about 480% before once again pulling back into consolidation.
A third accumulation zone formed through much of 2025, marked by tighter price ranges and declining volatility.
According to the chart, Dogecoin has recently broken higher from that third accumulation area. Price is now rising along a steep trajectory toward the upper boundary of a long term ascending channel that has guided the asset throughout the cycle.
Previous rallies stalled near this dotted resistance line, triggering pullbacks rather than immediate continuation.
The projection shown on the chart places the next potential upside target near the $0.70 level, which would represent a gain of roughly 450% from the recent consolidation range. That level aligns with the upper trendline that capped prior cycle peaks.
Despite the bullish projection, the historical pattern also shows that each move higher was followed by a sharp rejection and a drawn out retrace phase.
Momentum indicators are not shown on the chart, but the steepness of the recent advance suggests Dogecoin would need sustained volume and broader market strength to maintain its current trajectory.
For now, Dogecoin remains within its long term rising structure, trading above former accumulation zones.
Whether price can reach the upper channel near $0.70 will depend on whether the broader crypto market can deliver the same momentum seen during earlier breakout phases in this cycle.
Disclosure:This article does not contain investment advice or recommendations. Every investment and trading move involves risk, and readers should conduct their own research when making a decision.
Kriptoworld.com accepts no liability for any errors in the articles or for any financial loss resulting from incorrect information.

Tatevik Avetisyan is an editor at Kriptoworld who covers emerging crypto trends, blockchain innovation, and altcoin developments. She is passionate about breaking down complex stories for a global audience and making digital finance more accessible.
📅 Published: January 30, 2026 • 🕓 Last updated: January 30, 2026
