


Dogecoin fell out of a previously formed bullish flag pattern on Jan. 22, 2026, according to a four-hour DOGE/USD chart created on TradingView.
The setup had developed after a sharp early-January rally, when price surged and then began consolidating inside a downward-sloping channel.
Stay ahead in the crypto world – follow us on X for the latest updates, insights, and trends!🚀
That structure typically signals continuation, but the latest move changed the short-term outlook.
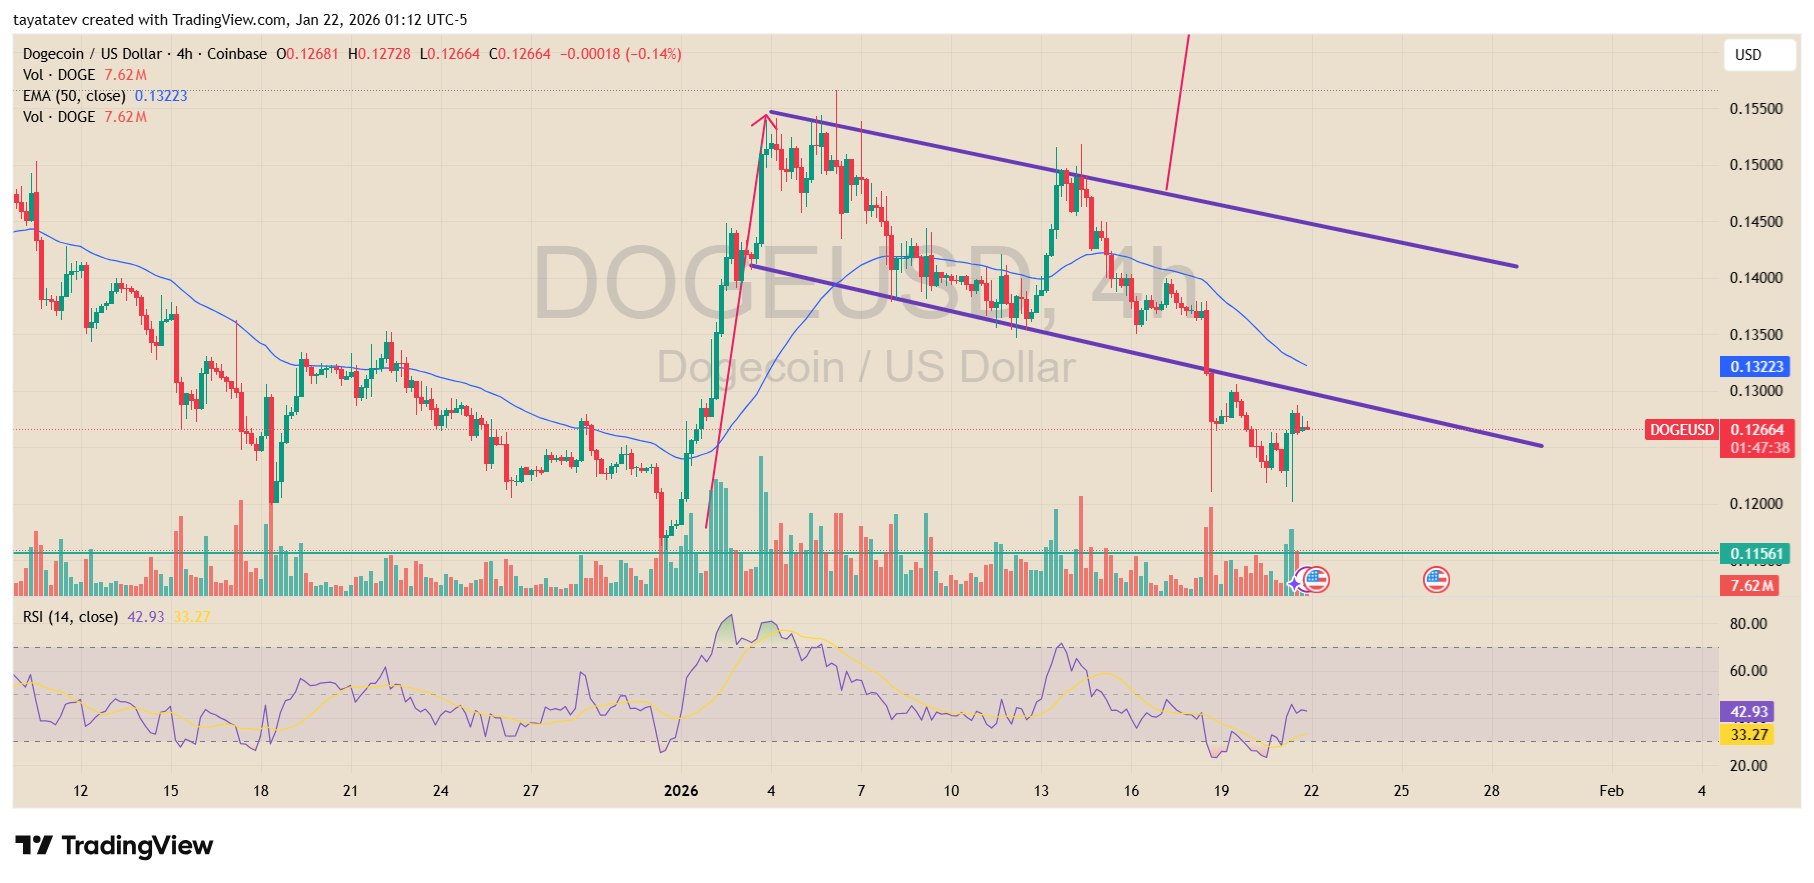
Initially, Dogecoin posted a strong impulse higher, which formed the flagpole. After that move, price action compressed between two declining trendlines, creating the bullish flag.
During this phase, trading activity cooled and momentum indicators eased, which aligned with a normal consolidation rather than a reversal. As a result, the pattern remained intact through mid-January.
However, price later slipped below the lower boundary of the flag. That breakdown marked a failure of the bullish continuation pattern and shifted focus to downside follow-through.
At the time of the chart, DOGE traded near $0.126, below the 50-period exponential moving average, which reinforced short-term pressure. Volume also expanded during the breakdown, adding confirmation to the move.
That said, the structure still leaves room for reassessment. If Dogecoin reclaims the broken flag zone and holds above it, price could move back toward the upper boundary of the former pattern.
A return into the flag would weaken the bearish signal and reopen the possibility of upside continuation. Until that happens, the failed bull flag remains the dominant technical signal on the chart.
DOGE Tests Support After Falling Wedge Breakout
Meanwhile, a TradingView chart showed Dogecoin pulling back into the $0.11–$0.12 support zone after breaking out of a falling wedge on the daily DOGE/USDT chart.
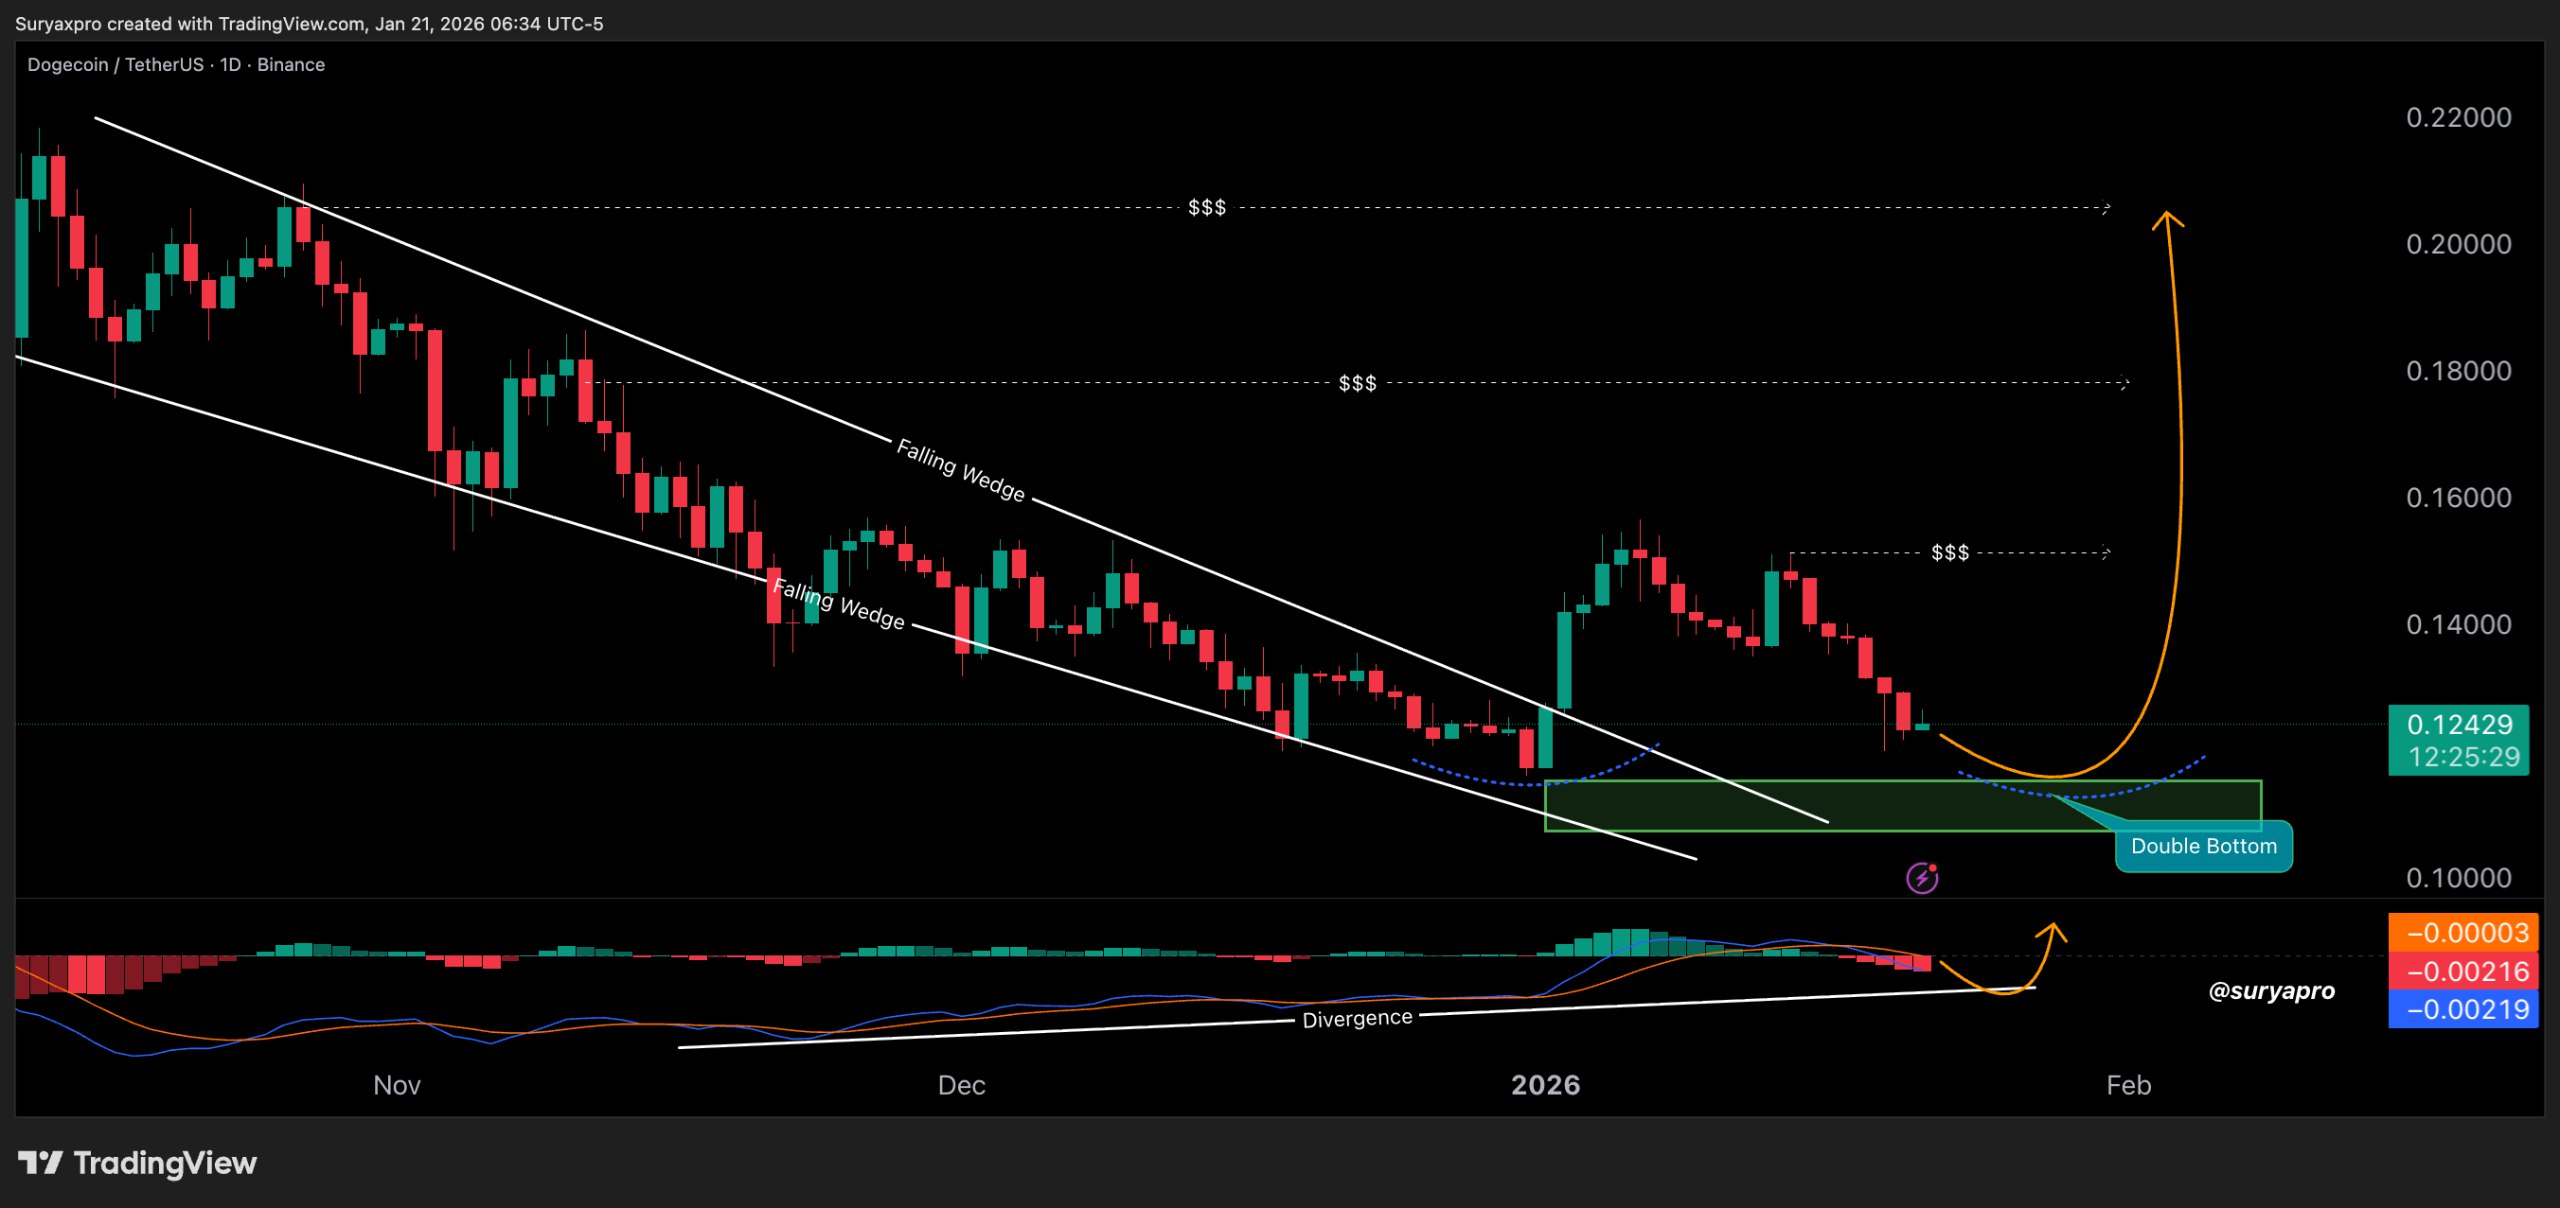
The structure traced a series of lower highs and lower lows from November through early 2026, forming a falling wedge. Price later moved above the upper boundary, a pattern traders often watch for a potential shift in trend.
After that move, Dogecoin retraced toward a highlighted demand area, where prior buying activity clustered.
The chart also marked a potential double bottom inside the same zone, reinforcing its technical importance.
At the same time, momentum indicators showed divergence, suggesting downside pressure weakened even as price revisited support.
In this context, holding the $0.11–$0.12 range would help complete a base and keep a rotation higher in play.
If price loses the zone cleanly, the earlier breakout would require reassessment.
The chart noted that macro-driven events can override technical structures and alter outcomes regardless of pattern signals.
Disclosure:This article does not contain investment advice or recommendations. Every investment and trading move involves risk, and readers should conduct their own research when making a decision.
Kriptoworld.com accepts no liability for any errors in the articles or for any financial loss resulting from incorrect information.

Tatevik Avetisyan is an editor at Kriptoworld who covers emerging crypto trends, blockchain innovation, and altcoin developments. She is passionate about breaking down complex stories for a global audience and making digital finance more accessible.
📅 Published: January 22, 2026 • 🕓 Last updated: January 22, 2026
