


A TradingView daily chart for Dogecoin versus the U.S. dollar on Coinbase, created on Dec. 17, 2025, showed DOGE trading near $0.1306 after a small daily decline.
The session printed O $0.13175, H $0.13240, L $0.12989, and C $0.13057, while price stayed pinned under the 50 day EMA near $0.15701.
Stay ahead in the crypto world – follow us on X for the latest updates, insights, and trends!🚀
Meanwhile, RSI 14 read about 36.87, and it held below its smoother line near 40.25, which kept momentum on the weak side.
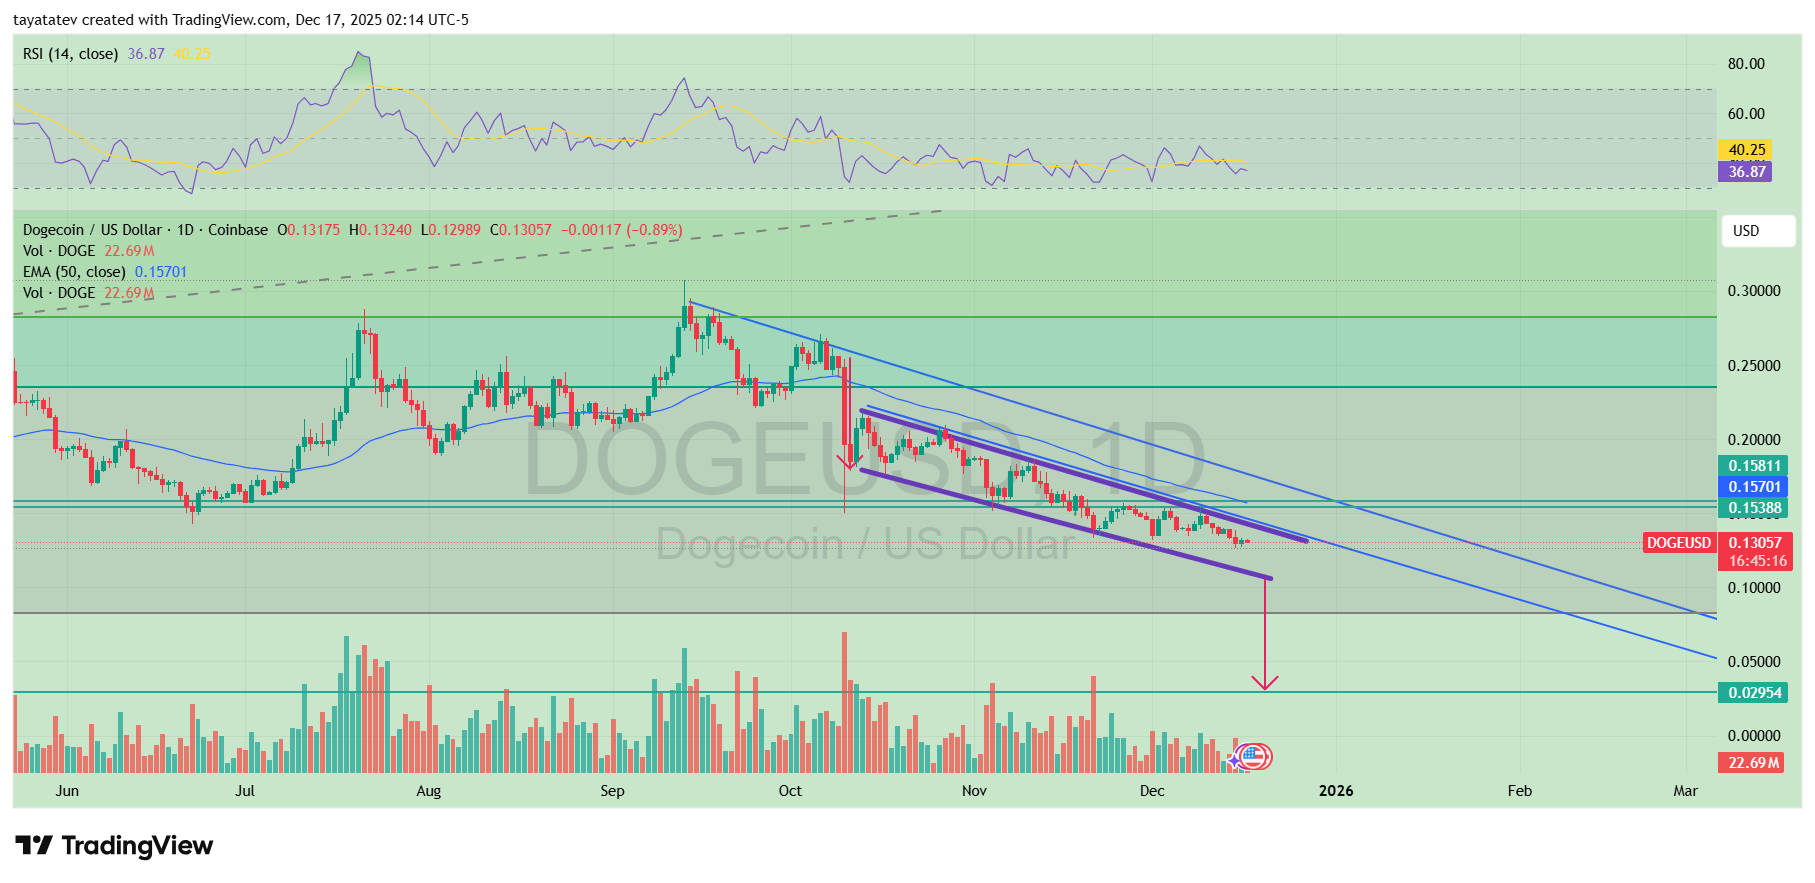
The chart also drew a bearish flag inside a broader descending channel. A bearish flag usually forms after a sharp selloff, then price drifts sideways to slightly higher in a tight, upward sloping range.
However, sellers often regain control when price breaks below the flag’s lower boundary, and then the prior downtrend continues.
Here, DOGE compressed along the lower edge of the flag while successive lower highs tracked the down sloping resistance lines.
As a result, the pattern does not confirm the full downside move yet, because confirmation requires a clean breakdown below the flag support with follow through.
Still, if price breaks that support and the measured move plays out, the chart’s projected target sits near $0.02954, which implies roughly a 78% drop from about $0.13057.
DOGEUSDT Chart Shows Liquidity Sweep Near Key Support
A daily Dogecoin Tether chart on Binance, shared on TradingView and dated Dec. 17, 2025, showed DOGE trading near $0.1315 after stabilizing at a long tested support zone.
The session printed O $0.12975, H $0.13186, L $0.12716, and C $0.13148, reflecting a modest daily gain.
Price action followed a sharp selloff in early October, after which DOGE entered a prolonged consolidation phase marked by declining highs and compressed ranges.
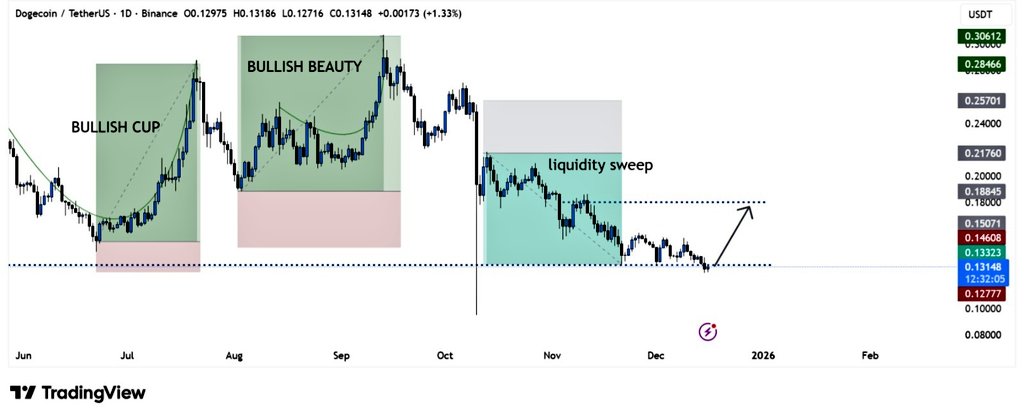
The chart highlighted a completed liquidity sweep below prior range lows. A liquidity sweep occurs when price briefly moves below a well watched support level to trigger stop losses and force weak long positions out.
After that flush, price often stabilizes if sell pressure fades. In this case, DOGE dipped below the dotted support line before quickly returning above it, which signaled that sellers failed to extend the move lower.
Earlier price action on the same chart showed two rounded recovery structures labeled as bullish cup formations during the summer, followed by a strong upside continuation that peaked above $0.30.
However, after the October breakdown, DOGE lost that structure and shifted into distribution and decline. Now, price sits near the $0.127 to $0.133 zone, where repeated reactions suggest active demand.
If buyers continue to defend this area, the chart allows for a relief bounce toward the $0.157 to $0.188 range, which aligns with prior consolidation levels and mid range resistance.
However, the setup remains conditional, because confirmation requires sustained closes above the dotted resistance line.
Until that happens, DOGE stays in a broader corrective phase despite the completed liquidity sweep.
Disclosure:This article does not contain investment advice or recommendations. Every investment and trading move involves risk, and readers should conduct their own research when making a decision.
Kriptoworld.com accepts no liability for any errors in the articles or for any financial loss resulting from incorrect information.

Tatevik Avetisyan is an editor at Kriptoworld who covers emerging crypto trends, blockchain innovation, and altcoin developments. She is passionate about breaking down complex stories for a global audience and making digital finance more accessible.
📅 Published: December 17, 2025 • 🕓 Last updated: December 17, 2025
