


Dogecoin is still trading on top of a key support level on the weekly chart, keeping a crucial line between bulls and bears intact for now.
Dogecoin Holds 0.5 Log Fibonacci Level From Cycle Low
Analyst Cantonese Cat highlighted that DOGE continues to respect the 0.5 logarithmic Fibonacci retracement drawn from the cycle low near $0.049 to the most recent high around $0.48. On the weekly
TradingView chart, that midpoint sits near $0.154, almost exactly where price is hovering.
The latest candle shows Dogecoin testing this band after several weeks of steady declines from the spring peak.
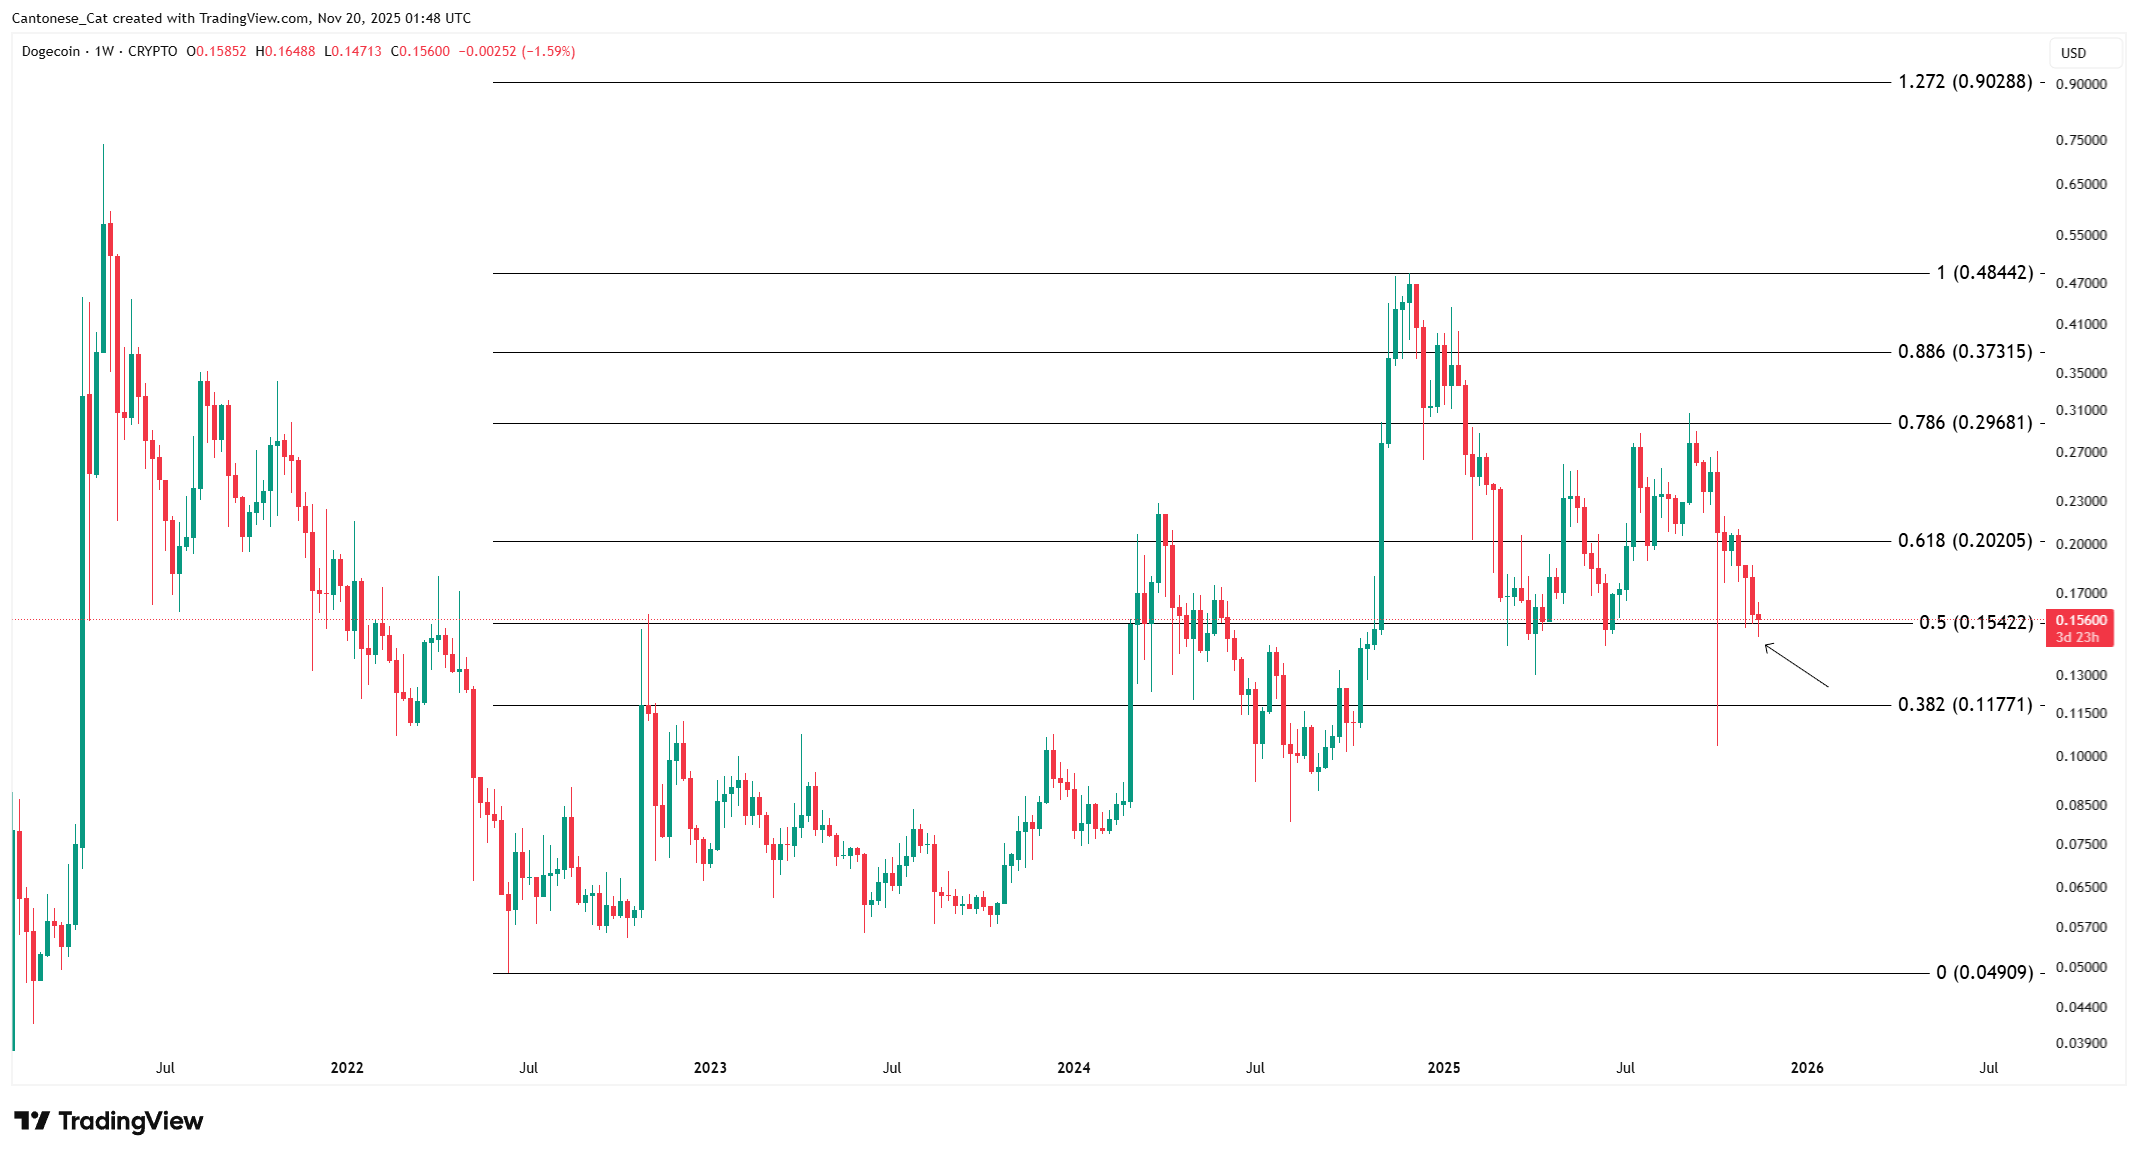
Because the retracement uses a log scale, each step between levels reflects proportional percentage moves rather than equal dollar distances.
As a result, the 0.5 line marks the halfway point of the entire advance from the 2023–2024 bottom to the 2025 top.
Many traders treat this zone as a neutral pivot: above it, the prior uptrend can still recover; below it, the move often looks more like a full reset.
So far, buyers have kept weekly closes near or slightly above the band, turning it into a first line of support.
However, the chart also shows lower highs since the last peak, which signals waning momentum even as the level holds.
If candles start closing decisively under $0.154, attention may shift to the next Fibonacci area around $0.118, where the 0.382 retracement sits.
For now, the structure remains balanced between these levels. The 0.618 retracement near $0.20 caps the overhead range, while the 0.5 line anchors the lower edge.
Until one side forces a clean break, Dogecoin’s weekly chart will likely keep sending the same message: the market is still respecting the midpoint of its cycle, but it is running out of room to avoid a stronger decision.
DOGE Supply on Exchanges Turns Positive After Months of Outflows
Dogecoin just recorded a sharp jump in exchange net position change, marking its first positive inflow in months, according to new data shared by analyst Ali.
The Glassnode chart shows DOGE’s exchange balance flipping from deep negative territory into a sudden green spike, indicating that more tokens have moved onto centralized platforms in recent days.
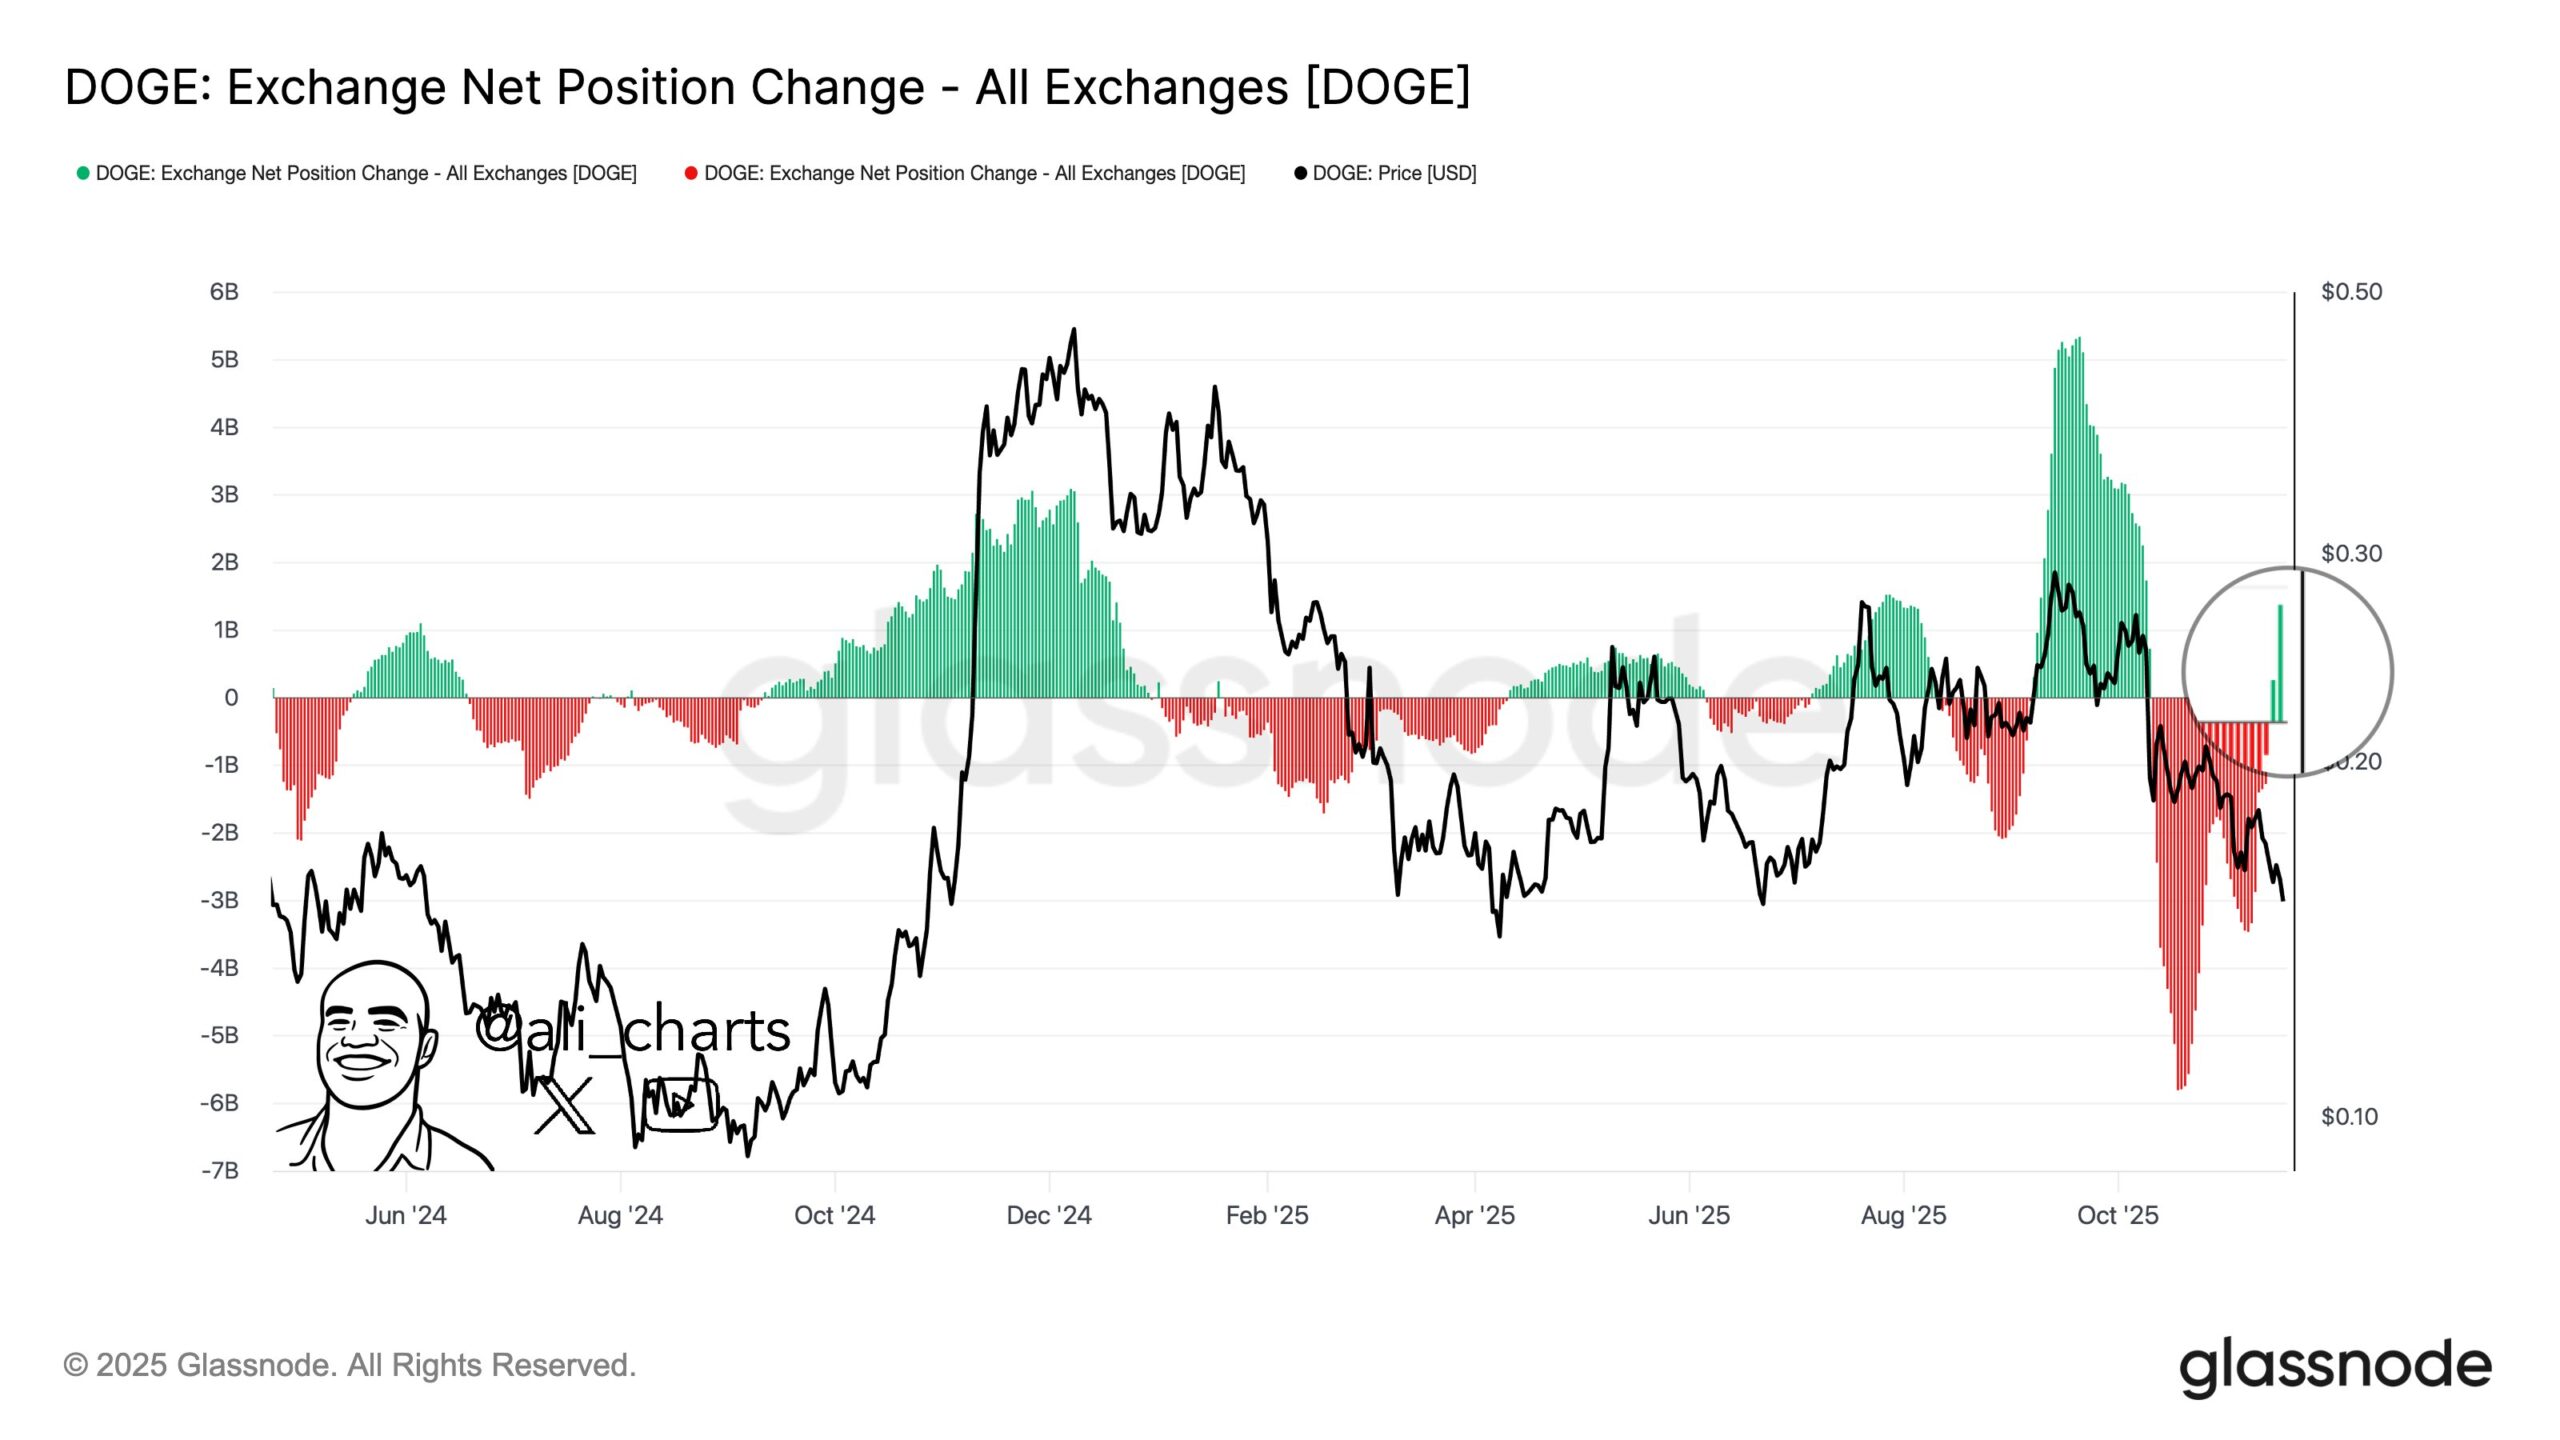
The indicator tracks the net amount of DOGE entering or leaving exchanges. For most of the past several months, the bars remained red as holders withdrew coins during periods of weakness.
That trend signaled reduced selling pressure as supply left trading venues. Now the gauge has surged into positive territory, showing a clear reversal from the persistent outflow pattern that dominated August through October.
Historically, these flips have aligned with sharp market moves. Previous green surges on the chart often occurred near major turning points, coinciding with strong rebounds after extended drawdowns.
While the current move does not confirm direction, the pattern highlights shifting behavior among holders and adds a new signal to the ongoing consolidation in DOGE’s price.
Disclosure:This article does not contain investment advice or recommendations. Every investment and trading move involves risk, and readers should conduct their own research when making a decision.
Kriptoworld.com accepts no liability for any errors in the articles or for any financial loss resulting from incorrect information.

Tatevik Avetisyan is an editor at Kriptoworld who covers emerging crypto trends, blockchain innovation, and altcoin developments. She is passionate about breaking down complex stories for a global audience and making digital finance more accessible.
📅 Published: November 20, 2025 • 🕓 Last updated: November 20, 2025
