

 rally rhythm points to $0.21 next — then $0.30")
Dogecoin (DOGE) has surged again, with analysts pointing to a repeating rally structure visible on the daily chart.
A new analysis by ChandlerCharts shows that DOGE’s upward moves have followed a rhythmic pattern over the past several months — with each major rally lasting between 29 and 35 days.
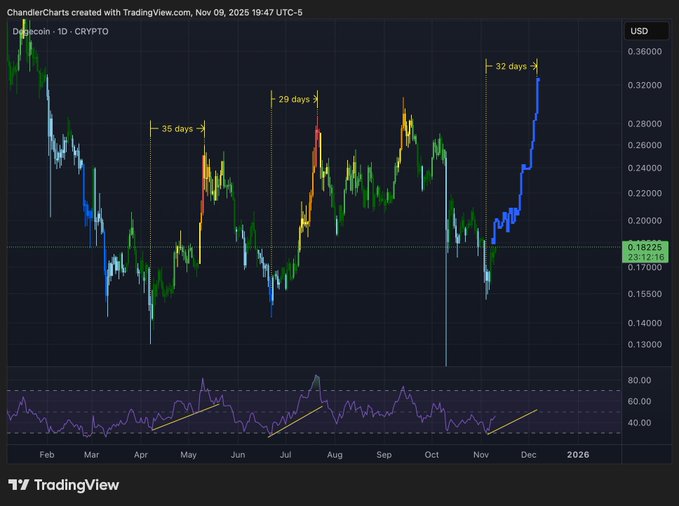
The latest uptrend, now about 32 days old, mirrors the timing of previous bullish waves seen in April, July, and September.
Each of those runs led to notable price peaks before a correction phase. The analyst suggested that the current structure could push Dogecoin toward the $0.30 mark, a level that aligns with the upper resistance of its recurring cycle.
Momentum indicators support the move. The relative strength index (RSI) shows a steady uptrend, signaling increasing buying pressure as price climbs higher.
If momentum persists, DOGE could test the psychological $0.30 zone, where traders often take profit.
The consistency of the pattern — rising every few weeks before cooling off — suggests that Dogecoin’s market rhythm remains intact.
However, analysts caution that similar setups in the past have ended with short-term pullbacks once overbought conditions appear.
Dogecoin rising wedge points to short-term push toward $0.21
On Nov. 10, 2025, Dogecoin (DOGE) traded near $0.183 on Coinbase while forming a rising wedge pattern on the one-hour chart.
The structure connects a series of higher highs and higher lows inside converging trendlines, with price grinding upward toward resistance.
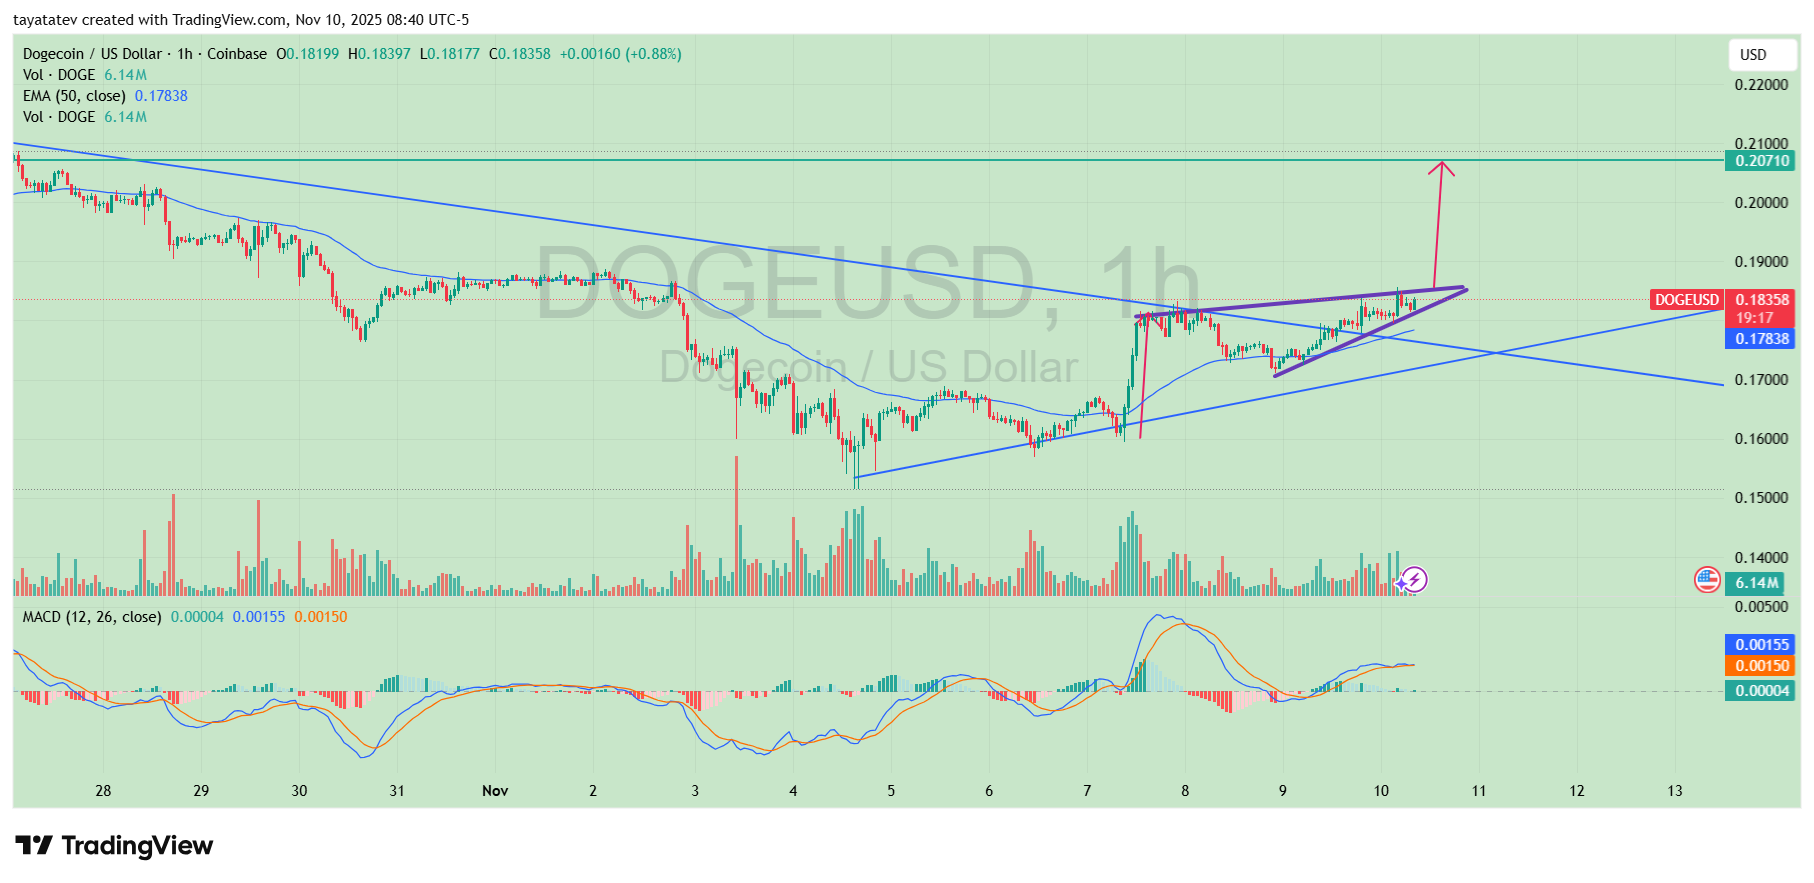
A rising wedge typically signals slowing upside momentum as buyers lose strength while price climbs. It often precedes a reversal once support breaks. In this case, however, the pattern still has room to extend.
The measured move from the base of the wedge suggests DOGE could gain about 12% if the upper boundary breaks, targeting roughly $0.21 — a level marked on the chart as the next resistance zone.
The 50-hour exponential moving average is rising under price and now acts as short-term support, helping sustain the current uptrend.
At the same time, the MACD lines hover above the zero line after a recent bullish crossover, indicating that positive momentum remains in place, although histogram bars show that buying pressure is not explosive.
If Dogecoin closes decisively above the wedge’s upper trendline with stronger volume, it would confirm the pattern’s upside objective toward $0.21.
A failure at resistance, followed by a break below the lower trendline, would instead turn the formation into a warning of a deeper pullback toward the mid-$0.17 area.
Disclosure:This article does not contain investment advice or recommendations. Every investment and trading move involves risk, and readers should conduct their own research when making a decision.
Kriptoworld.com accepts no liability for any errors in the articles or for any financial loss resulting from incorrect information.

Tatevik Avetisyan is an editor at Kriptoworld who covers emerging crypto trends, blockchain innovation, and altcoin developments. She is passionate about breaking down complex stories for a global audience and making digital finance more accessible.
📅 Published: November 10, 2025 • 🕓 Last updated: November 10, 2025
