


A TradingView ETHUSD daily chart on Bitstamp, created Dec. 30, 2025, showed Ethereum trading near $2,948 after compressing into a tight triangle that fits a bearish pennant setup.
The structure formed after a sharp drop in November, then shifted into lower highs and higher lows, which often signals a pause before the prior downtrend either resumes or fails.
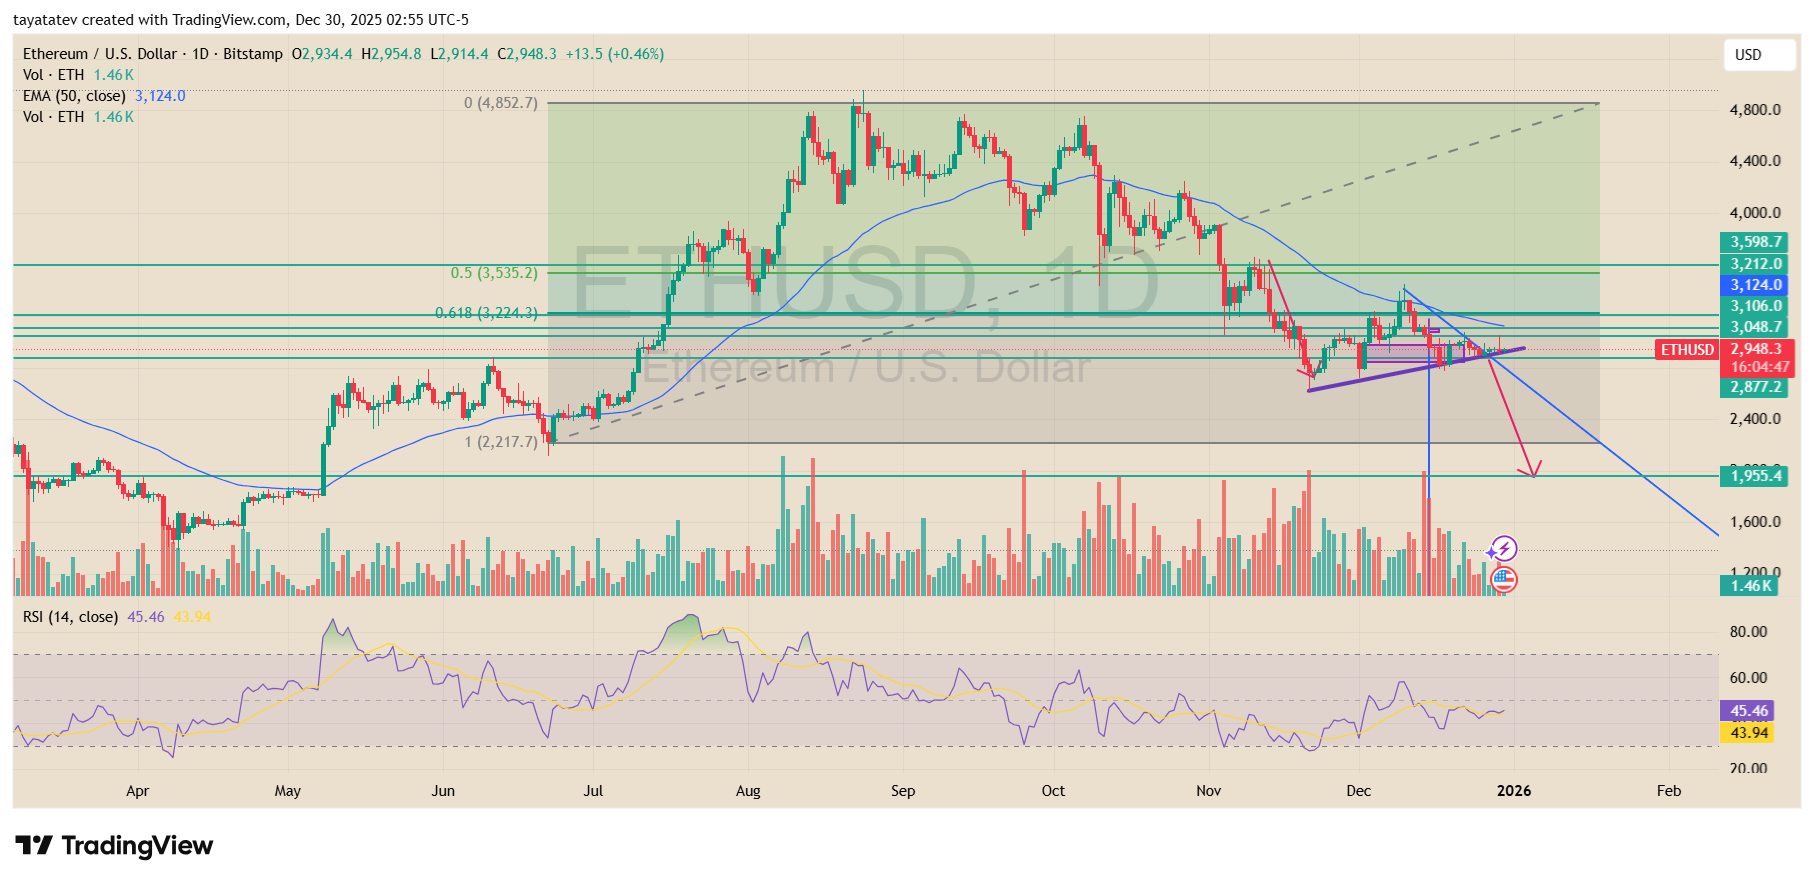
A bearish pennant is a continuation pattern. It usually starts with a steep selloff called the flagpole, then price contracts into a small, symmetrical triangle as volatility fades.
Traders watch the triangle’s lower boundary because a clean breakdown tends to confirm the pattern, while a push above the upper boundary weakens the bearish case.
On this chart, Ethereum also sat below the 50 day EMA near $3,124, which acted as overhead pressure into late December.
The RSI hovered in the mid 40s, pointing to weak momentum rather than a strong rebound phase.
The drawing on the chart marked a potential breakdown path toward the high $1,900s, close to the $1,955 level highlighted as a lower support area.
If the bearish pennant confirms from the current area around $2,948, a 33% downside move would target about $1,975.
That implied level lines up with the chart’s nearby $1,955 support zone, which becomes the next major area traders would compare against the projected drop.
ETH to stables ratio nears April crash low as traders watch prior bottom signals
A two week ETH to stables ratio chart from CryptoCap showed ETH divided by a basket of USDT, USDC, and DAI trading near 1.39, with recent candles drifting back toward the band marked as the “2025 Tariff Low.”
The chart framed that area as the same region tested during the April crash, which now sits just above the highlighted support zone around 1.28.
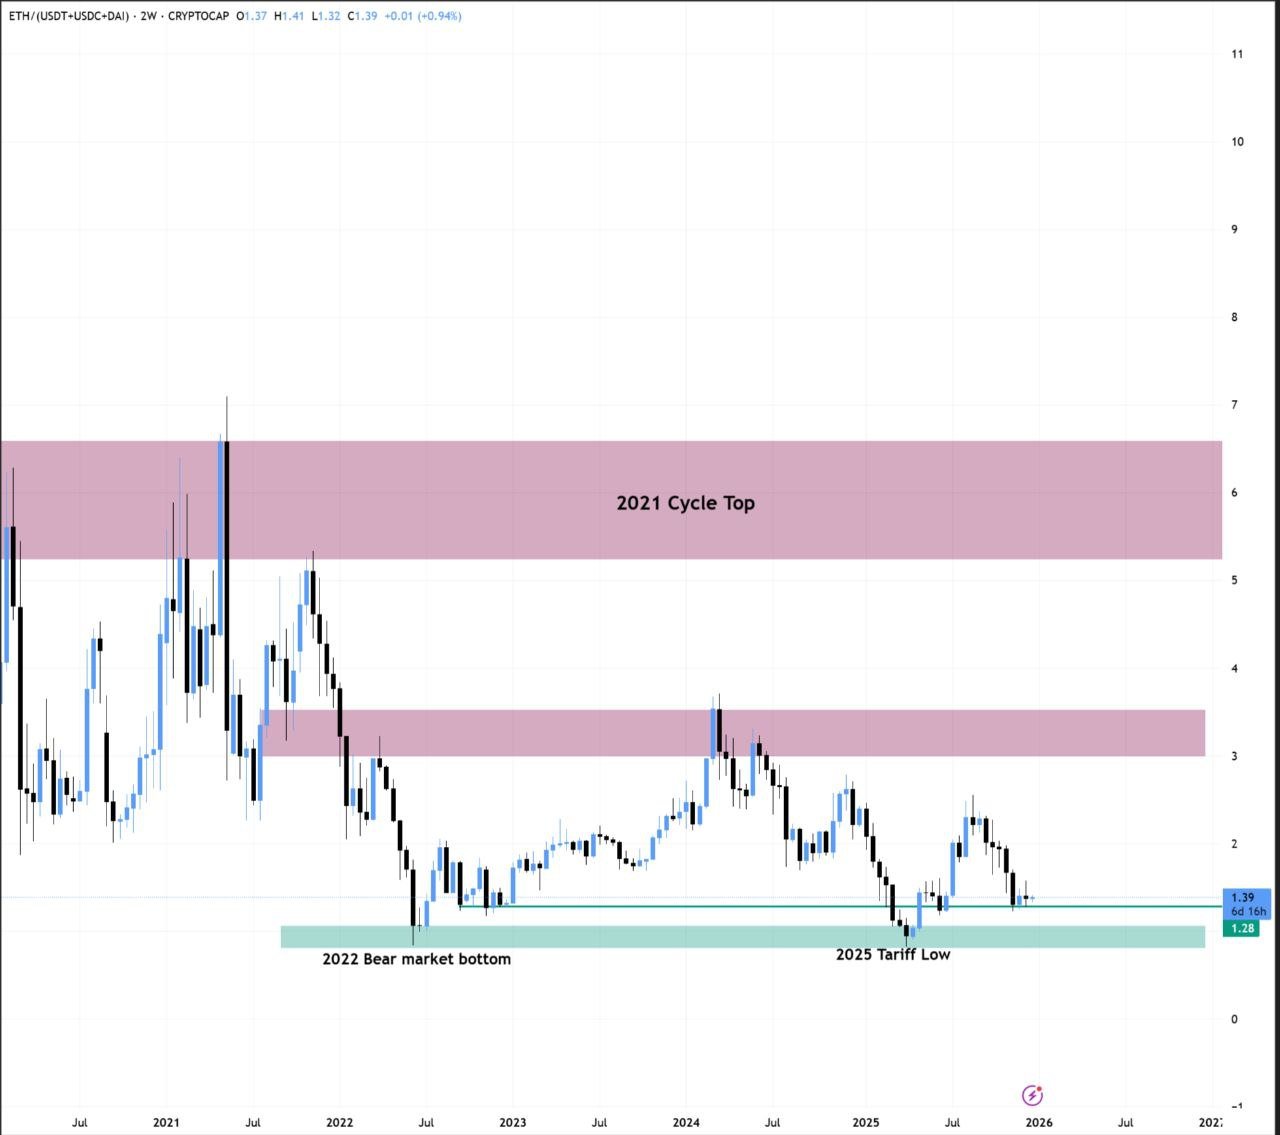
The view also mapped two major overhead supply areas from prior cycles. One zone sat near the “2021 Cycle Top,” while another marked a lower resistance band closer to the mid range of the chart.
Price never revisited those levels in 2025 and instead rolled over into late year, keeping the ratio pinned near its lows.
In an X post, Web3Niels said ETH stables approaching the April crash low had only happened twice and that both instances marked the pico bottom for Ethereum.
The claim describes a historical pattern on this ratio, where extreme lows signaled capitulation relative to stablecoins, although the chart itself does not guarantee the same outcome will repeat.
Disclosure:This article does not contain investment advice or recommendations. Every investment and trading move involves risk, and readers should conduct their own research when making a decision.
Kriptoworld.com accepts no liability for any errors in the articles or for any financial loss resulting from incorrect information.

Tatevik Avetisyan is an editor at Kriptoworld who covers emerging crypto trends, blockchain innovation, and altcoin developments. She is passionate about breaking down complex stories for a global audience and making digital finance more accessible.
📅 Published: December 30, 2025 • 🕓 Last updated: December 30, 2025
