


Ethereum traded near $2,040 on the 4 hour chart from Binance after a sharp selloff from late January highs.
Price stayed below the 50 period EMA near $2,176, and therefore the broader structure kept a downside bias.
Stay ahead in the crypto world – follow us on X for the latest updates, insights, and trends!🚀
At the same time, the recent bounce lifted ETH off the early February low near the high $1,700s.
However, price still failed to reclaim the moving average, which kept pressure on short term rebounds.
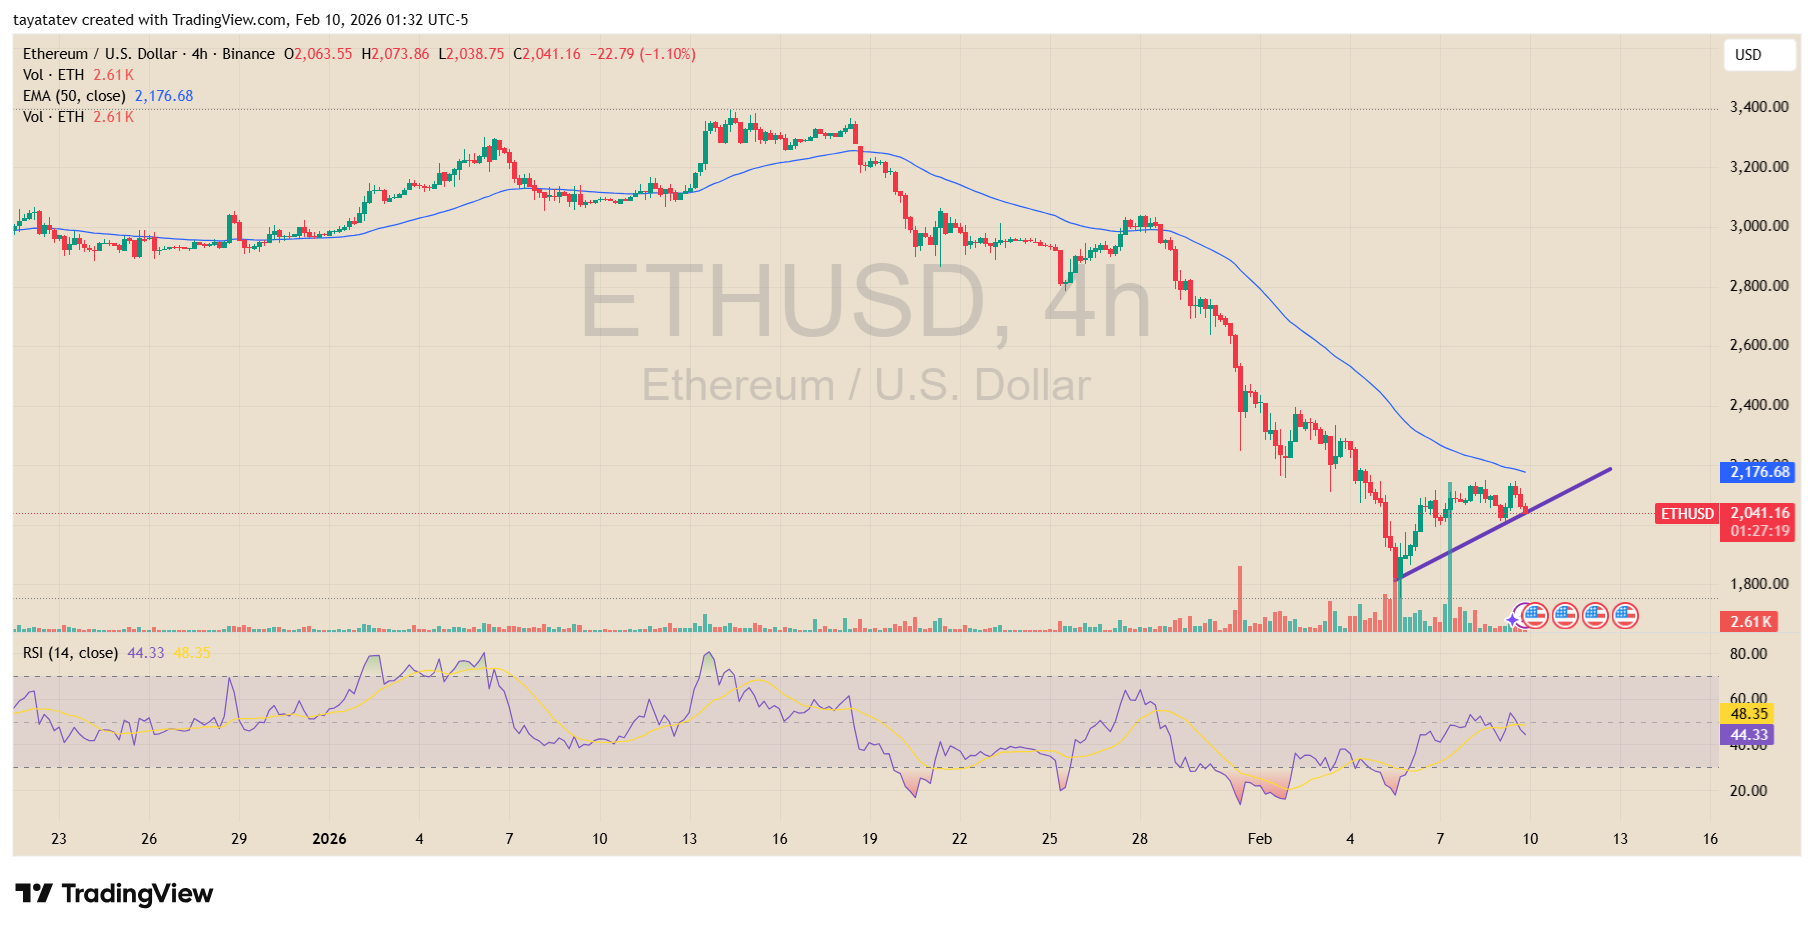
The latest structure formed a bear flag on the 4 hour chart. After the steep drop, ETH moved higher inside a narrow, rising channel.
That pattern often appears during pauses within downtrends. As a result, the current push higher looks like a corrective move rather than a clear trend shift.
In addition, volume expanded during the selloff and faded during the rebound, which fits a bear flag setup.
ETH now tests the $2,000 area as near term support. Price has respected this zone during the latest consolidation, and therefore it acts as the key line in the sand.
If ETH holds above $2,000, price may extend the rebound toward the lower edge of the 50 period EMA and nearby resistance around $2,150 to $2,200.
However, if ETH breaks back below $2,000, the bear flag risks resolving lower. In that case, sellers could press price toward the prior demand zone in the high $1,700s to low $1,800s.
Momentum indicators reflect the same mixed tone. RSI on the 4 hour chart recovered from oversold levels and moved toward the mid range.
However, it stayed below the neutral 50 line, and therefore momentum did not confirm a bullish shift. Meanwhile, price continued to print lower highs under the falling EMA.
As a result, the chart structure still points to a corrective bounce within a broader downtrend rather than a confirmed reversal.
Hidden Bullish Divergence Shows Higher Low as ETH Sells Off
Ethereum traded near $2,080 on the 2 day Coinbase chart as analyst Javon Marks pointed to what he called a “hidden bullish divergence” in ETH.
The setup showed price holding a higher low on the chart even as the oscillator printed a fresh lower low, a combination that traders sometimes read as a sign the broader uptrend may still hold after a pullback.
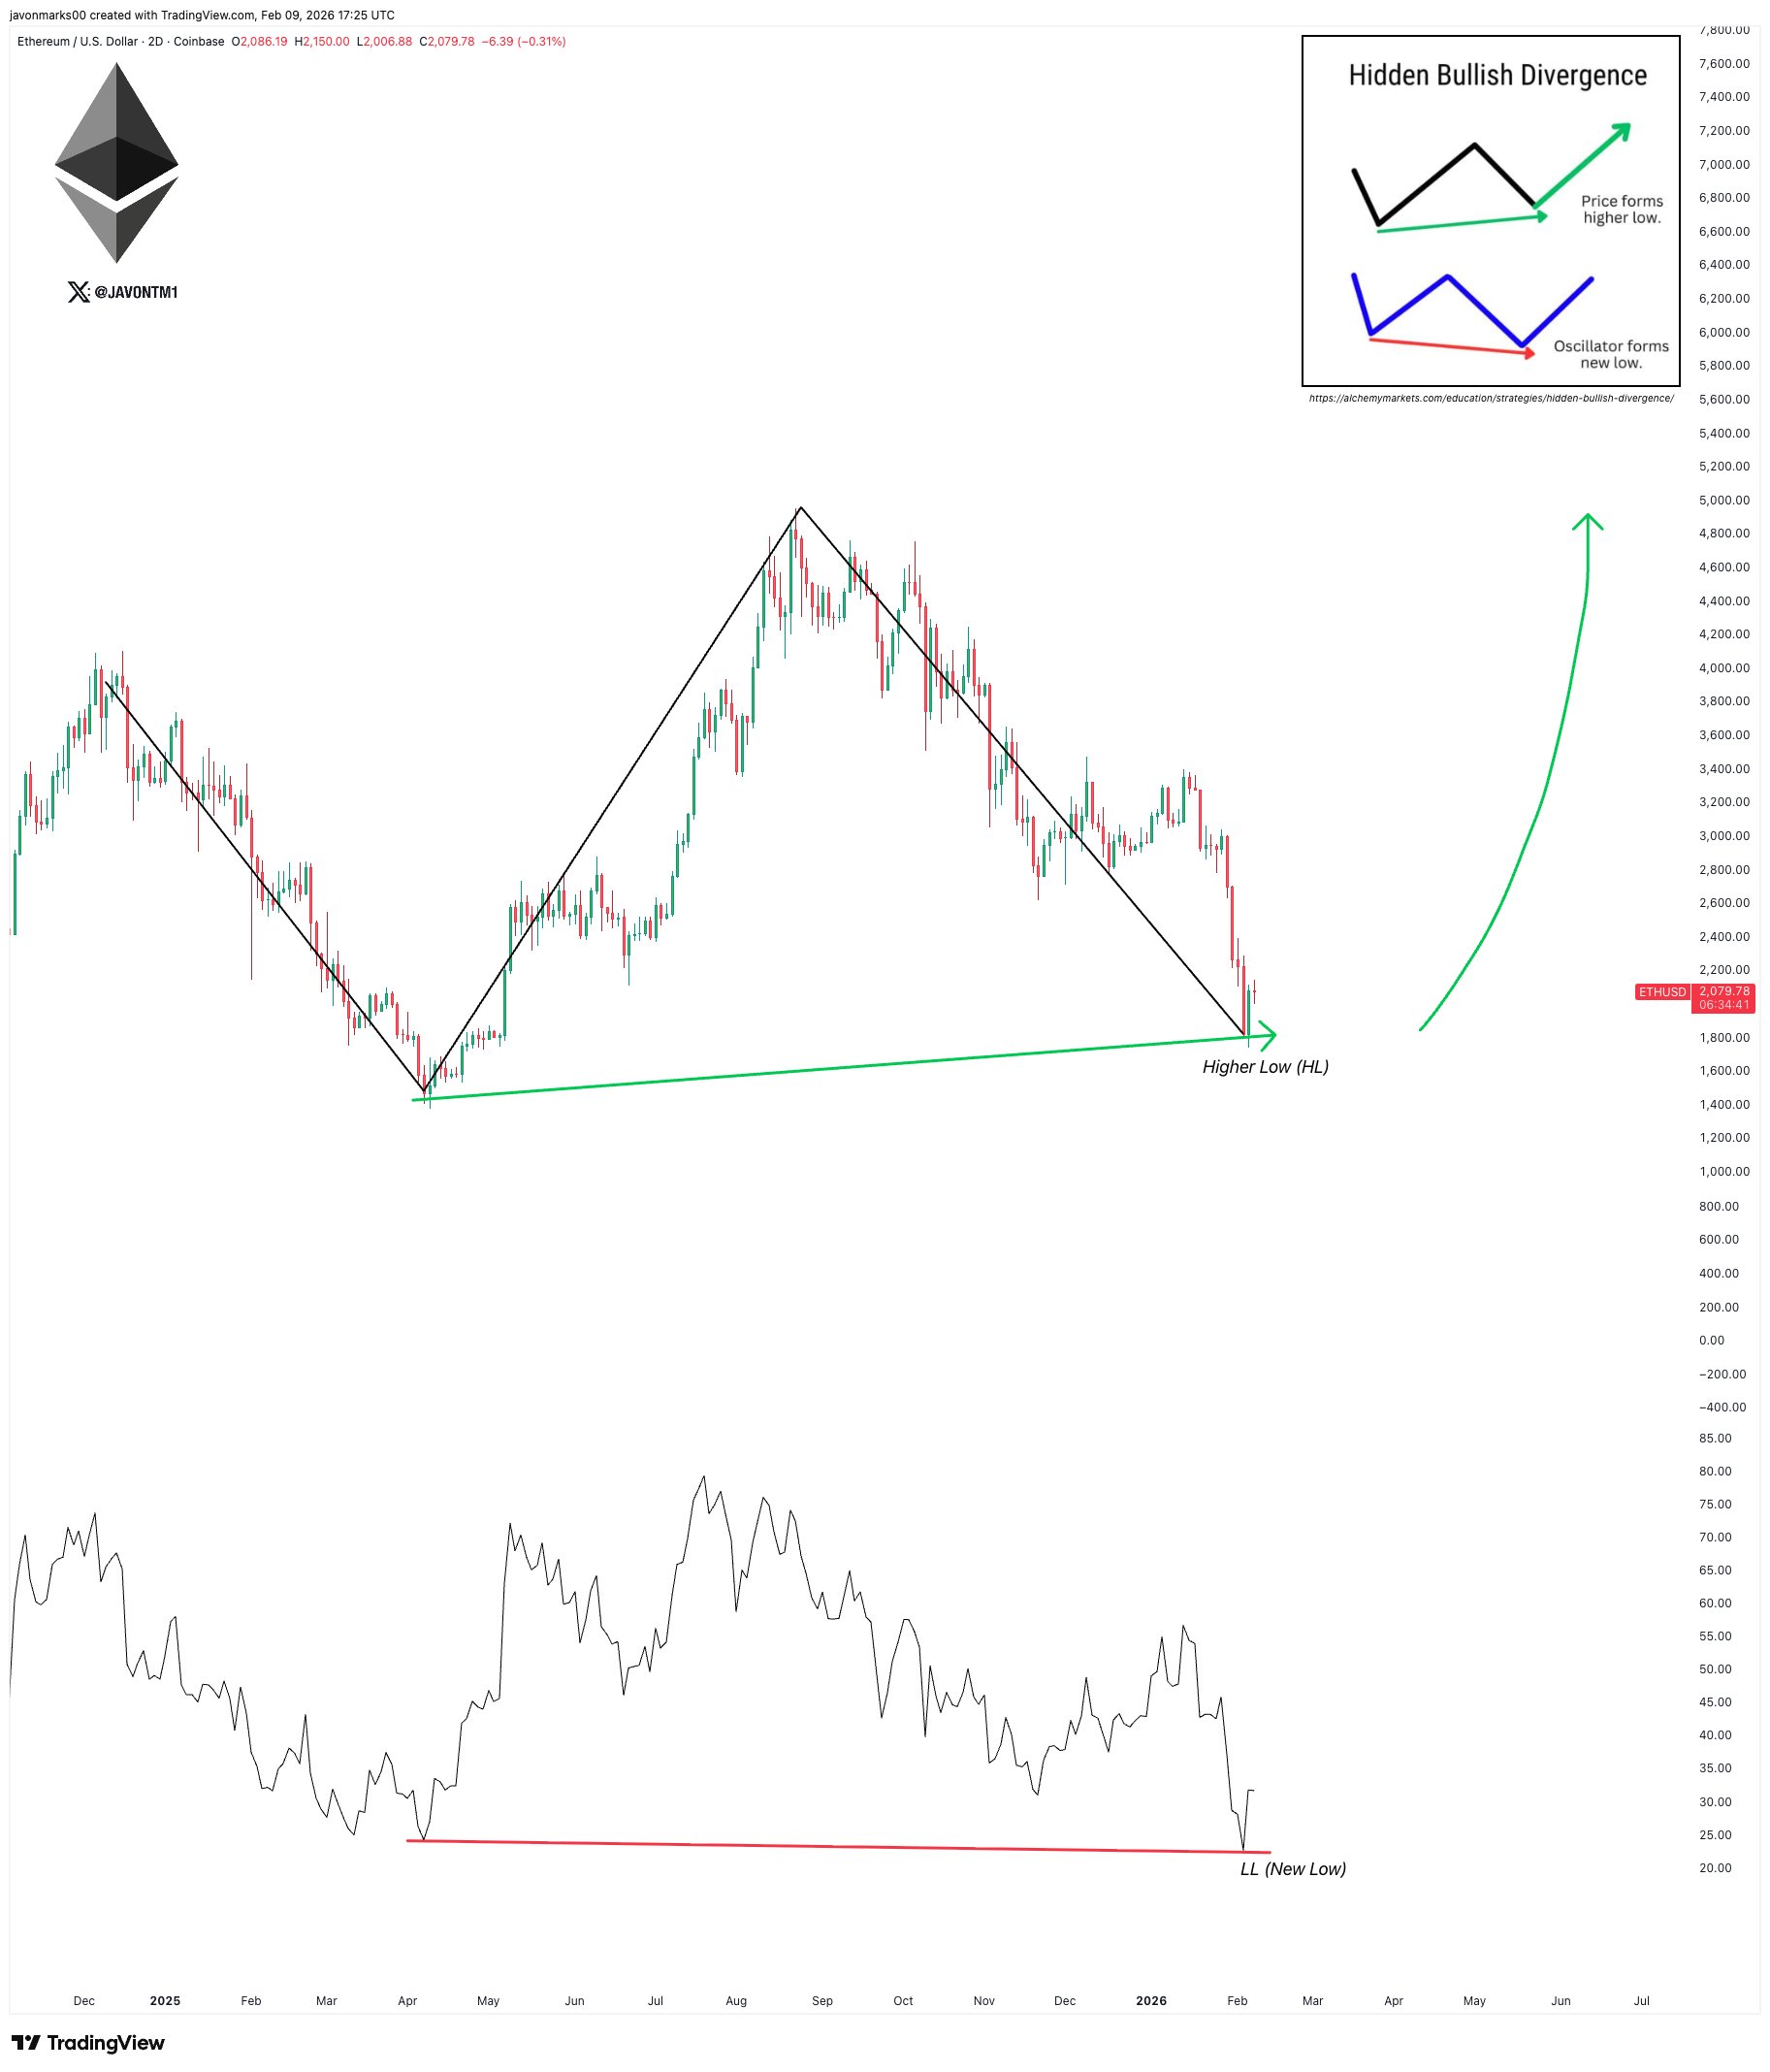
Marks highlighted a long swing structure that peaked above $4,000 before ETH slid through a steep down leg into early 2026.
On the price chart, the latest drop landed at a level the drawing labeled as a higher low, while the indicator line below dipped to a new low marked “LL.”
As a result, the chart framed the move as momentum weakening during the decline even though price did not break its prior major base.
Based on that pattern, Marks said a rally “back towards” the $5,000 area could follow.
However, the chart also showed ETH still coming off a sharp downside leg, and therefore the next direction depends on whether price can stabilize above the higher low area instead of extending the selloff.
Disclosure:This article does not contain investment advice or recommendations. Every investment and trading move involves risk, and readers should conduct their own research when making a decision.
Kriptoworld.com accepts no liability for any errors in the articles or for any financial loss resulting from incorrect information.

Tatevik Avetisyan is an editor at Kriptoworld who covers emerging crypto trends, blockchain innovation, and altcoin developments. She is passionate about breaking down complex stories for a global audience and making digital finance more accessible.
📅 Published: February 10, 2026 • 🕓 Last updated: February 10, 2026
