


Ethereum is showing its first early signs of an uptrend after months of lower highs, with the price now pressing against a key resistance near 3,212 dollars.
The daily chart signals that a break above this level would confirm a shift in structure after a prolonged downward trend.
Stay ahead in the crypto world – follow us on X for the latest updates, insights, and trends!🚀
Ethereum trades around 3,121 dollars, sitting directly under the descending trendline that has capped rallies since August.
The chart shows the trendline meeting horizontal resistance between 3,212 and 3,307 dollars, forming a tight zone that now controls ETH’s direction.
The 50-day exponential moving average sits near 3,307 dollars, adding another layer of resistance.
ETH has not closed above this moving average since early autumn, making this test significant for market structure.

At the same time, ETH has started to form a small series of higher lows through late November and early December.
These higher lows show that sellers failed to create new breakdowns while buyers gradually defended the 3,048 to 2,877 dollar support zone.
This behavior often appears during the early stages of trend reversals, especially when buyers defend the same price area multiple times. The chart reflects steady but moderate volume, suggesting accumulation rather than aggressive trading.
The relative strength index has climbed back into the 50 zone, recovering from oversold conditions seen earlier in the month.
The RSI’s steady rise aligns with price stability and indicates that downward momentum lost strength.
If RSI holds above 50 while price retests the downtrend line, ETH gains a stronger technical case for upside continuation.
Despite the early signs, ETH needs a daily close above 3,212 dollars to confirm the start of a broader uptrend. That level marks the intersection of horizontal resistance and the descending trendline.
A breakout would open the path toward 3,307 dollars, followed by the next target around 3,598 dollars, where sellers previously rejected rallies. However, failure at this resistance may keep ETH inside the downward channel.
If price pulls back again, the chart shows clear support levels at 3,048 dollars and 2,877 dollars.
These levels held during multiple retests in November, showing consistent demand.
A drop below 2,877 dollars would invalidate the higher-low structure and return ETH to a deeper corrective phase.
Ethereum Holds 3,100 Dollars as Buyers Defend Support
Ethereum is holding above the 3,100 dollar level, where buyers keep stepping in to support the price.
The chart shows repeated bounces from the 3,000–3,100 dollar zone, which signals that demand in this area remains active.
Each dip into this band has met fresh bids so far, preventing a deeper move back toward the lower support blocks.
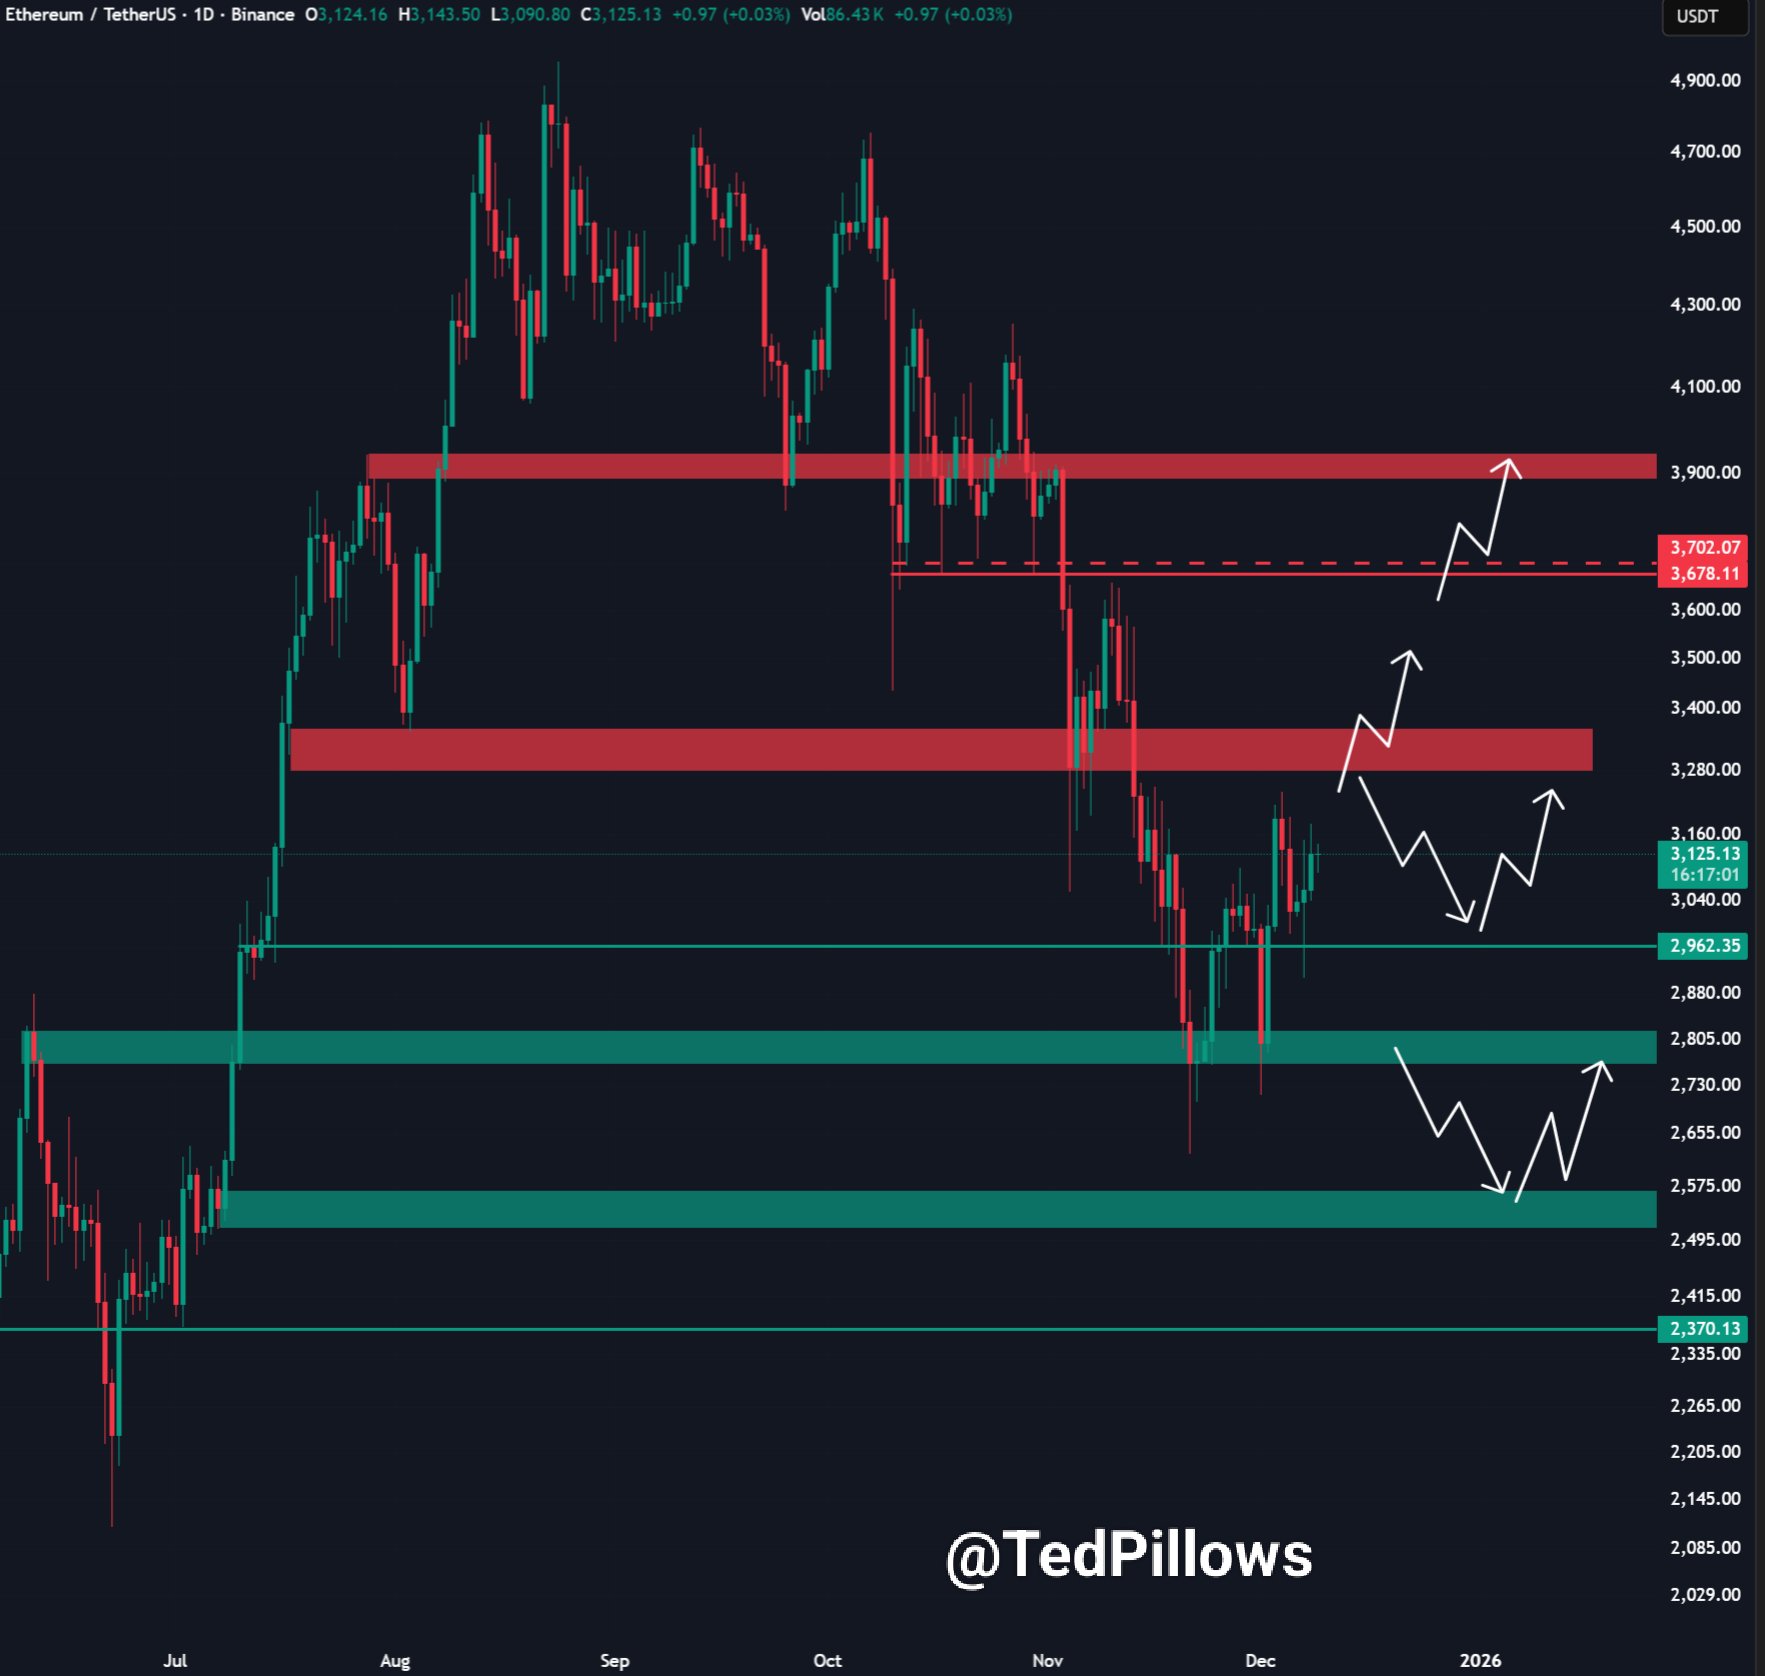
At the same time, ETH now faces a major ceiling between 3,300 and 3,400 dollars.
This zone lines up with a prior breakdown area where sellers previously pushed the market lower, so it acts as a key test for the current recovery.
If price stalls here again, Ethereum could stay trapped in a range, with traders continuing to fade moves near resistance and buy dips close to support.
Looking ahead, analyst TedPillows notes that a clean break above the 3,300–3,400 dollar resistance band, backed by strong trading volume, would change the picture.
In that scenario, he says the path could open toward the next upside targets around 3,700–3,800 dollars over the following weeks.
Until that breakout happens, however, the chart still revolves around the same structure: firm bids near 3,000–3,100 dollars and heavy supply stacked above 3,300 dollars.
Disclosure:This article does not contain investment advice or recommendations. Every investment and trading move involves risk, and readers should conduct their own research when making a decision.
Kriptoworld.com accepts no liability for any errors in the articles or for any financial loss resulting from incorrect information.

Tatevik Avetisyan is an editor at Kriptoworld who covers emerging crypto trends, blockchain innovation, and altcoin developments. She is passionate about breaking down complex stories for a global audience and making digital finance more accessible.
📅 Published: December 9, 2025 • 🕓 Last updated: December 9, 2025
