


As of Dec. 22, 2025, the Ethereum USD 4 hour chart shows a clear shift back into an uptrend after last week’s pullback.
Price continues to print higher lows, while structure now holds above the rising diagonal support drawn from early December.
Stay ahead in the crypto world – follow us on X for the latest updates, insights, and trends!🚀
This change in structure suggests buyers have regained control after the sharp mid month selloff.
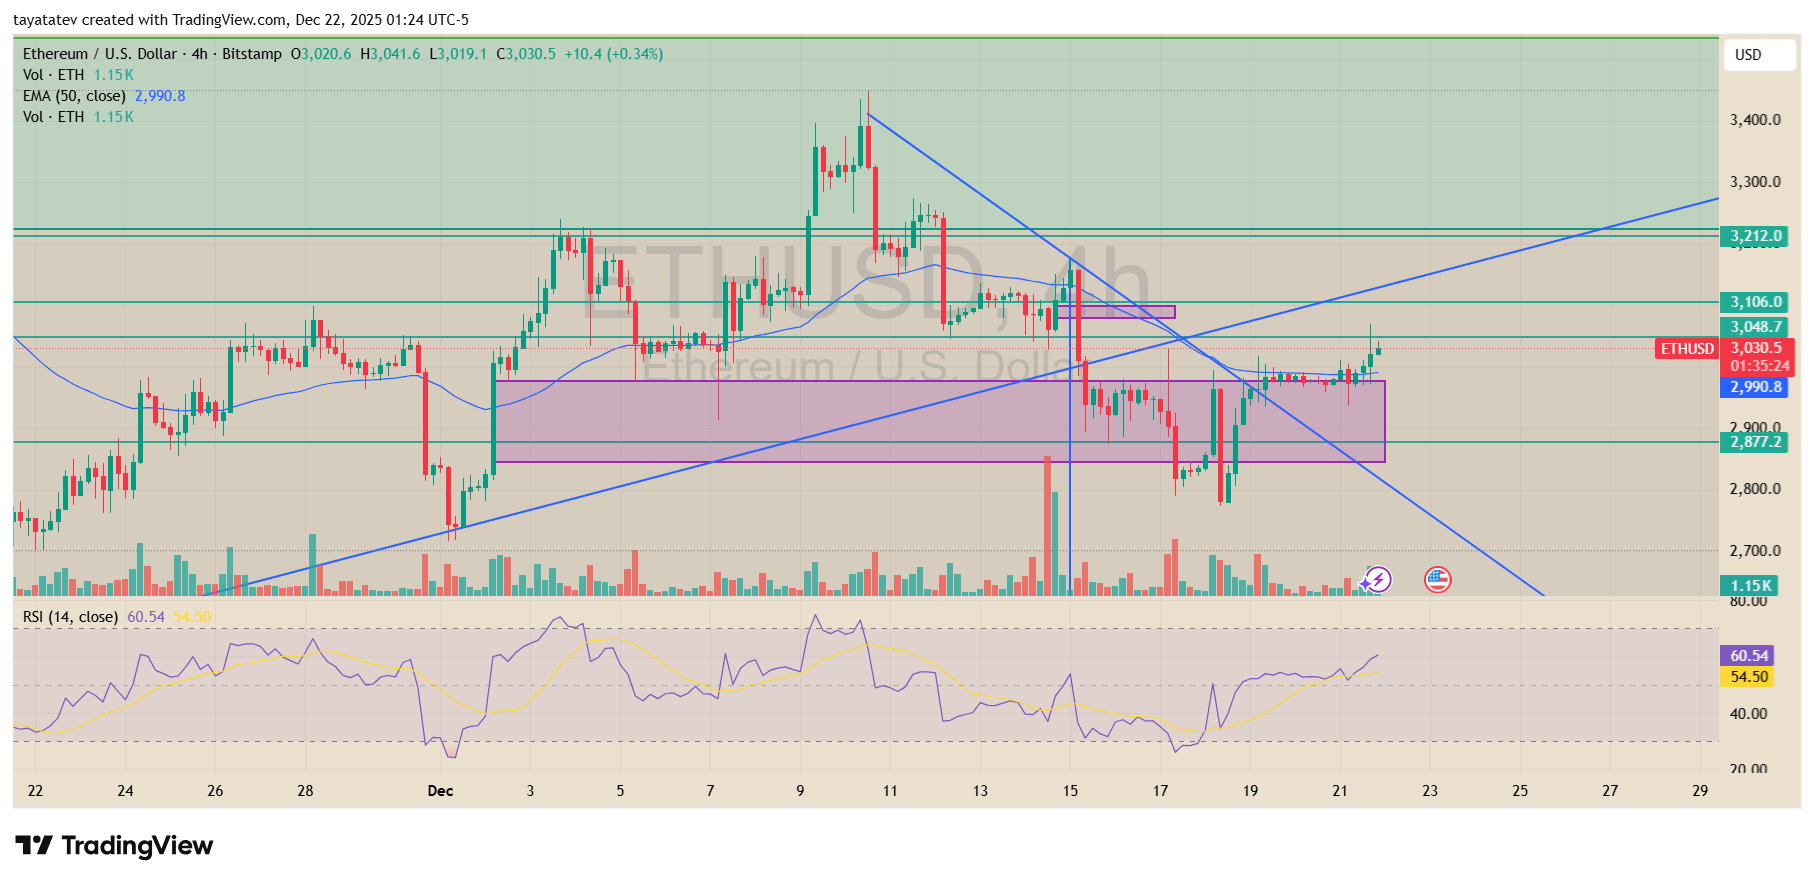
Importantly, Ethereum has fully moved through the prior fair value gap that formed during the impulsive drop earlier this month.
Price did not stall inside that imbalance and instead reclaimed it, which signals that sell side inefficiency has been absorbed.
This behavior usually supports continuation rather than rejection, especially when combined with higher low formation.
The $2,877–$2,990 zone acted as a demand area and held multiple tests. From there, ETH rebounded and reclaimed the 50 period EMA near $2,990, which now acts as dynamic support.
As long as price remains above this level, the short term trend bias stays constructive rather than corrective.
For confirmation of the uptrend, $3,048 remains the key level to watch. A sustained move and hold above $3,048 would confirm the higher high and validate trend continuation toward the $3,106 and $3,212 resistance zones marked on the chart.
Until that level breaks cleanly, ETH remains in a rebuilding phase within an emerging uptrend rather than a fully confirmed expansion move.
Momentum also supports this view. The RSI has recovered above the midline, showing improving bullish momentum without entering overbought territory.
This suggests room for continuation if price confirms above resistance, while downside remains protected as long as ETH holds above reclaimed support and the former fair value gap area.
ETH price trades near $2,971 as analyst maps $2,825–$2,894 support and $3,018 breakout level
Ethereum traded around $2,971 on the 1 hour ETHUSD chart on Binance, while a widely shared TradingView setup highlighted two nearby decision zones.
A post on X from Man of Bitcoin said his preferred path remains a pullback into a support area between $2,894 and $2,825, while adding that a sustained break above $3,018 would signal a direct move higher.
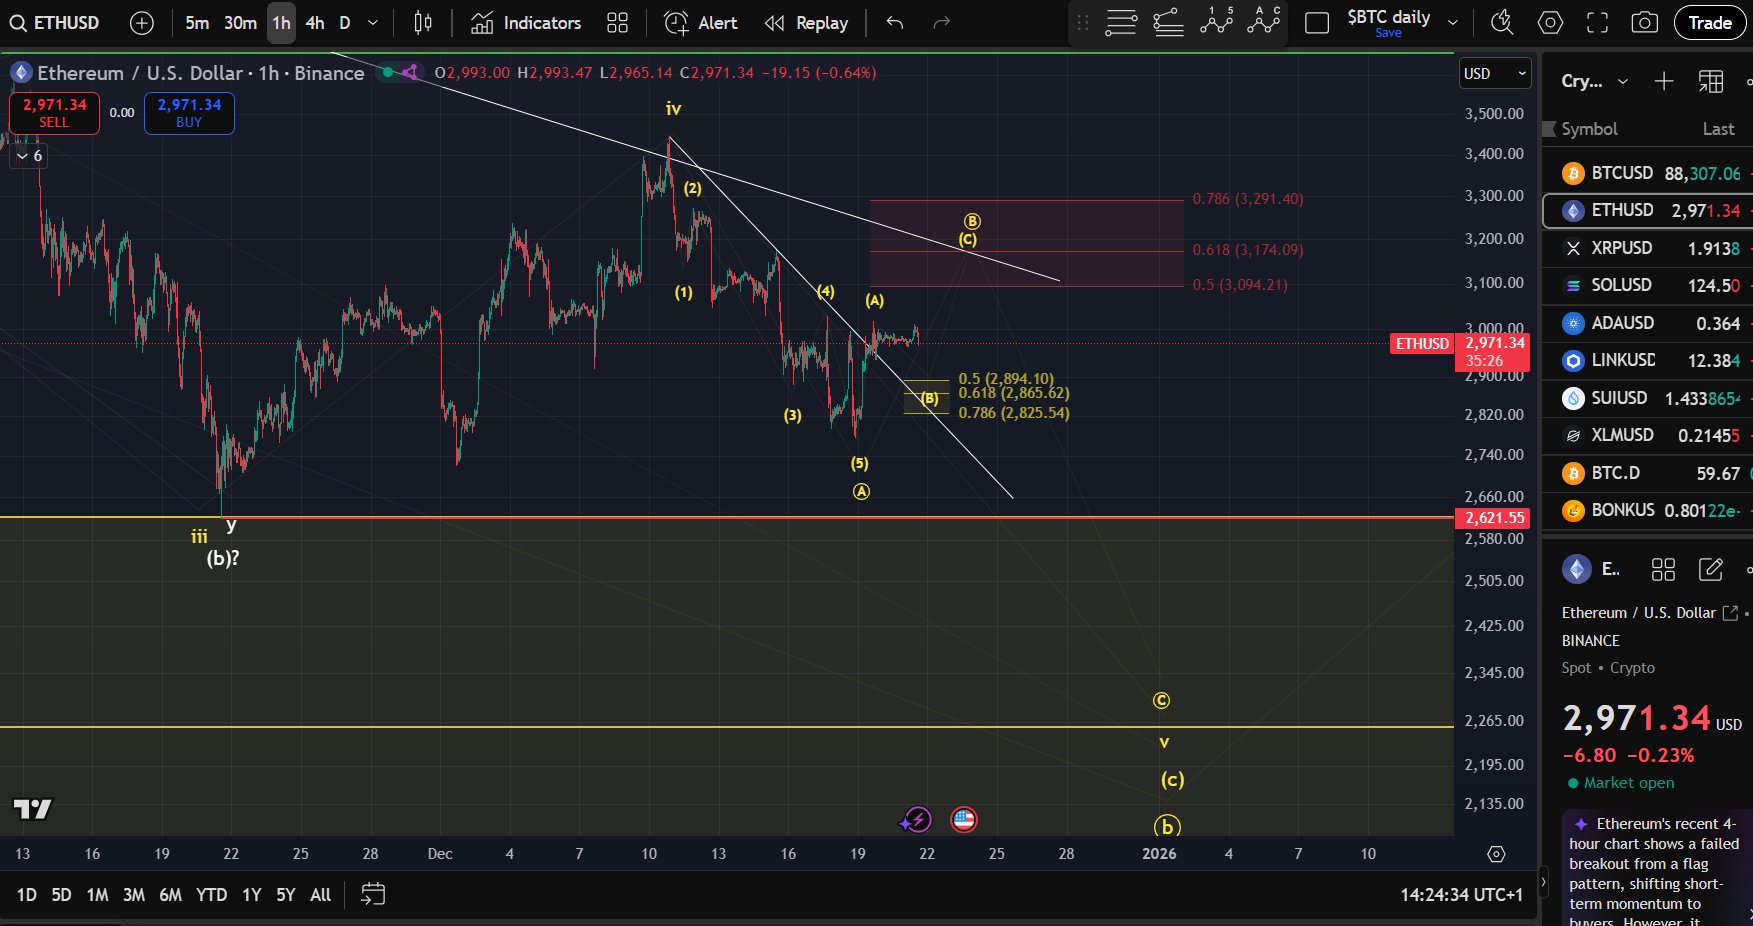
The chart shows ETH rebounding from a recent swing low and then moving sideways below the $3,000 handle.
Price also sits under a descending trendline drawn from the prior high, which has capped several recovery attempts.
That leaves ETH in a tight range where the next move depends on whether buyers can clear overhead resistance or whether the market revisits the marked support band.
The $2,894–$2,825 area stands out as the closest demand zone on the chart. It aligns with a recent consolidation shelf and sits near multiple retracement markers, which often attract bids during pullbacks.
If ETH drops into that band and holds, it would keep the rebound structure intact and set up another attempt at the trendline and the nearby resistance cluster.
On the upside, $3,018 acts as the key trigger level from the post.
A sustained break above it would place ETH back above the most immediate resistance line and shift focus to the higher highlighted zone on the chart, where Fibonacci levels sit around $3,094, $3,174, and $3,291.
Until ETH holds above $3,018, the chart still frames the move as a recovery inside a broader down move rather than a fully confirmed upside continuation.
Disclosure:This article does not contain investment advice or recommendations. Every investment and trading move involves risk, and readers should conduct their own research when making a decision.
Kriptoworld.com accepts no liability for any errors in the articles or for any financial loss resulting from incorrect information.

Tatevik Avetisyan is an editor at Kriptoworld who covers emerging crypto trends, blockchain innovation, and altcoin developments. She is passionate about breaking down complex stories for a global audience and making digital finance more accessible.
📅 Published: December 22, 2025 • 🕓 Last updated: December 22, 2025
