


It seems like the once-mighty altcoin is facing some tough times again, with its market dominance dropping from 18.85% last year to just 13.36% now. So, is it time to start worrying?
Quite a decline
The popular analyst, Benjamin Cowen shared that this decline in Ethereum’s market share signals ongoing selling pressure, as it has been struggling to maintain higher levels of dominance, and historically, it has faced challenges breaking through the 16% and 22% marks since 2018.
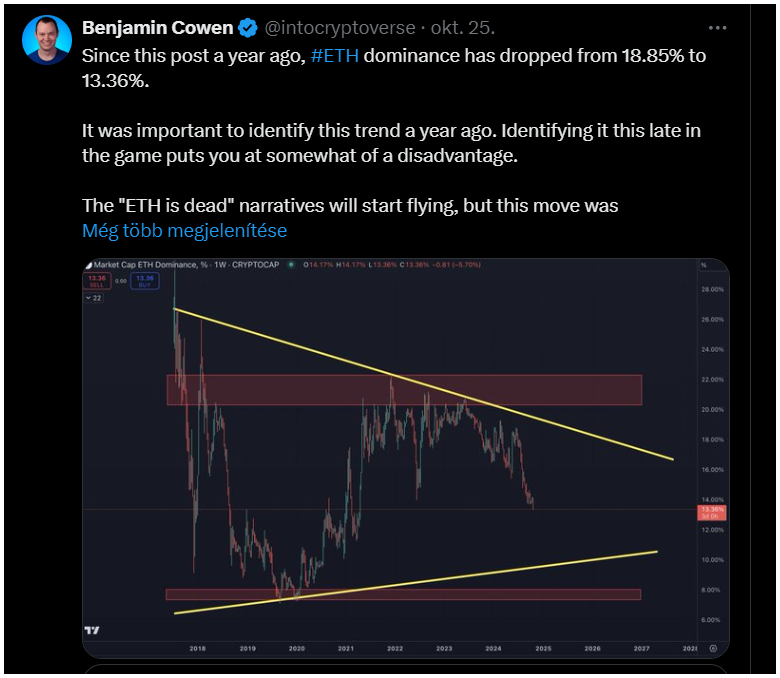
Right now, it looks like Ethereum is caught in a descending triangle pattern, which typically hints at a bearish trend.
Cowen suggests that if this downward trend continues, we might see Ethereum’s dominance slip further, potentially hitting a support level between 9% and 10%.
This would be quite a drop and could be driven by waning buying interest. If ETH does hit that 9% level, it could become a critical point for the cryptocurrency, especially if the overall market doesn’t favor alts in the near future.
If Ethereum manages to hold above this support level, it might stabilize and set the stage for a rebound in 2025.
But if it breaks below 9%, we could be looking at a longer stretch of underperformance compared to other altcoins and actually the whole crypto market.
What’s happening with ETH?
As of now, Ethereum is trading at $2,540, with a slight increase of 0.59% over the past 24 hours but down by 3.11% over the last week.
Its trading volume is around $17.6 billion, so there’s still plenty of activity happening.
Ethereum’s market cap stands at about $306.29 billion, and the Total Value Locked on Ethereum’s network is currently $47.91 billion. Daily fees are around $3.55 million, and revenue sits at $2.55 million.
Inflows to the network have been about $38.78 million over the past day, with active addresses numbering around 372,911.
These figures show that even though Ethereum’s dominance is declining, it’s still being actively used, the fundamentals are strong. But are they enough?
Mixed signals in market activity
Interestingly, data reveals a +52.90% increase in inflows over the past week and a +28.94% uptick over the last month, and this is often a sign that traders are moving assets onto exchanges in preparation for selling or taking profits.
But there’s been an enormous -64,155.88% shift towards net outflows in the past 90 days, meaning that many investors are withdrawing their ETH from exchanges.
This short-term influx aligns with the overall bearish sentiment in the market as more Ethereum moves to exchanges, usually signaling an intent to sell.
On the other hand, those long-term net outflows suggest that some users are accumulating ETH by moving it off exchanges for storage or staking.
