

")
Analysts and traders remain optimistic about a potential BTC price breakout, despite crab market.
On-chain data indicates that BTC may be heating up to replicate its previous rally to all-time highs from March.
Signals everywhere
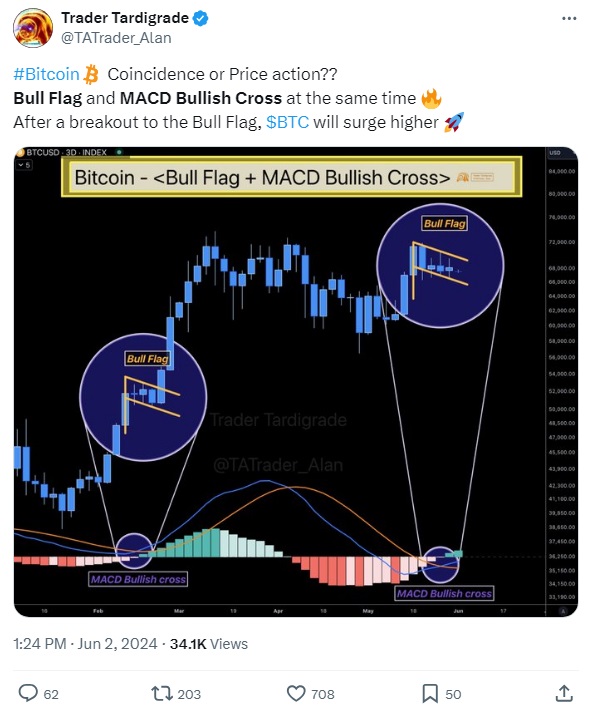
In a June 2 post on X, well-known trader and commentator Alan Tardigrade highlighted an interesting similarity between the current BTC price action and the pattern observed in mid-February this year, and according to Tardigrade, BTC could be on the brink of repeating its fast climb to new all-time highs, driven by a key on-chain indicator.
Earlier this year, BTC surged to new all-time highs within a month when a classic metric signaled bullish momentum.
Now this same setup appears to be forming again, suggesting strength in BTC’s price.
Tardigrade pointed out the alignment of a bull flag pattern and a bullish cross on the Moving Average Convergence Divergence, the MACD indicator.
He noted that after breaking out of the bull flag, BTC could see substantial gains.
It happend already, so it will again?
The MACD, which assesses trend strength, is currently forming positive bars on the three-day timeframe after a period of decline that began in early April. Simultaneously, BTC/USD is consolidating within a bull flag.
The last time BTC exited this pattern alongside a bullish MACD, it quickly reached new all-time highs.
Market observers have long monitored the three-day MACD for insights into the current BTC bull market.
In late December, the chart showed that a return to red territory on the MACD preceded volatility related to the launch of the United States’ spot BTC ETFs.
The BTC market’s zodiac is the bull, the crab, or the bear?
Despite BTC’s current price consolidation below the March highs for nearly three months, some traders are still confident that the cryptocurrency will stay rangebound for a while longer, and we have to endure the crab market.
This hasn’t changed the enthusiasm for high BTC price predictions, the research firm Fundstrat Global Advisors has set a target of $150,000 for 2024, while some traders are eyeing $85,000 or more in June.
The consensus remains that the most dramatic phase of the bull run, the parabolic rise has yet to begin.
The financial sector is increasingly realizing the benefits of incorporating and accumulating BTC, suggesting that the average person may have less time to acquire BTC at current price levels than anticipated.
