


An X user who posts under the handle Tryrex said he placed a limit short setup on Ether, pointing to a price zone where ETH has “reacted multiple times,” as shown on an 8 hour ETH USDT linear futures chart from TradingView using Bitunix data.
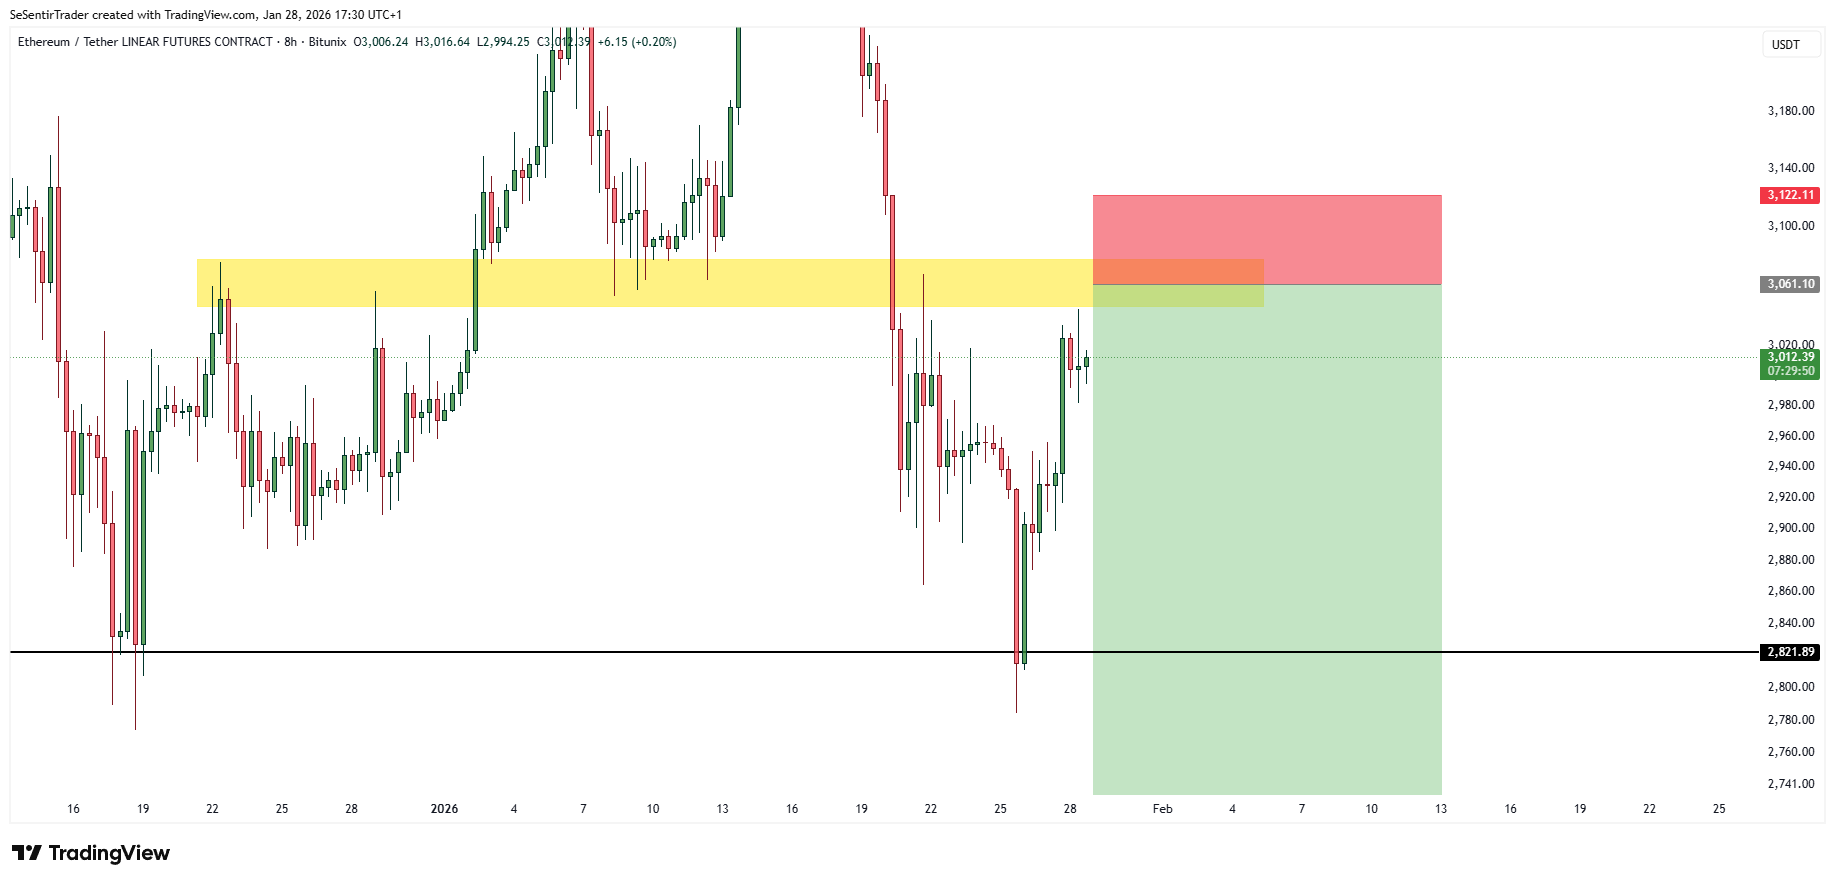
The chart showed ETH trading near $3,012 on Jan. 28 after rebounding from a sharp late month drop that briefly drove price down to about $2,822, a level marked as a key horizontal line.
After that low, ETH climbed back toward a highlighted resistance band around the low $3,000s, where the chart’s yellow zone sits.
Tryrex compared the ETH level he is watching to a Bitcoin retest around $90,000 to $91,000, framing it as a clean area for an entry rather than a trend call.
He also wrote that ETH can trade more “precise” levels than Bitcoin, and said he planned to watch for what he called a “sniper entry.”
On the chart, the marked short idea placed risk above the resistance area, with a red stop zone extending toward roughly $3,122.
Meanwhile, the profit area extended below the current price into the mid to high $2,700s, with the $2,822 line sitting between the two zones as a nearby reference level.
The post reflected a common derivatives approach in which traders fade repeated resistance after a bounce, then define risk above the prior reaction area.
ETH Reclaims Prior Range After Sharp Breakdown
Meanwhile, an X user who posts under the name Ezekiel, with the handle duje matic, shared a TradingView chart of ETHUSDT perpetual futures on Binance, writing “#eth” and adding, “hear me out.”
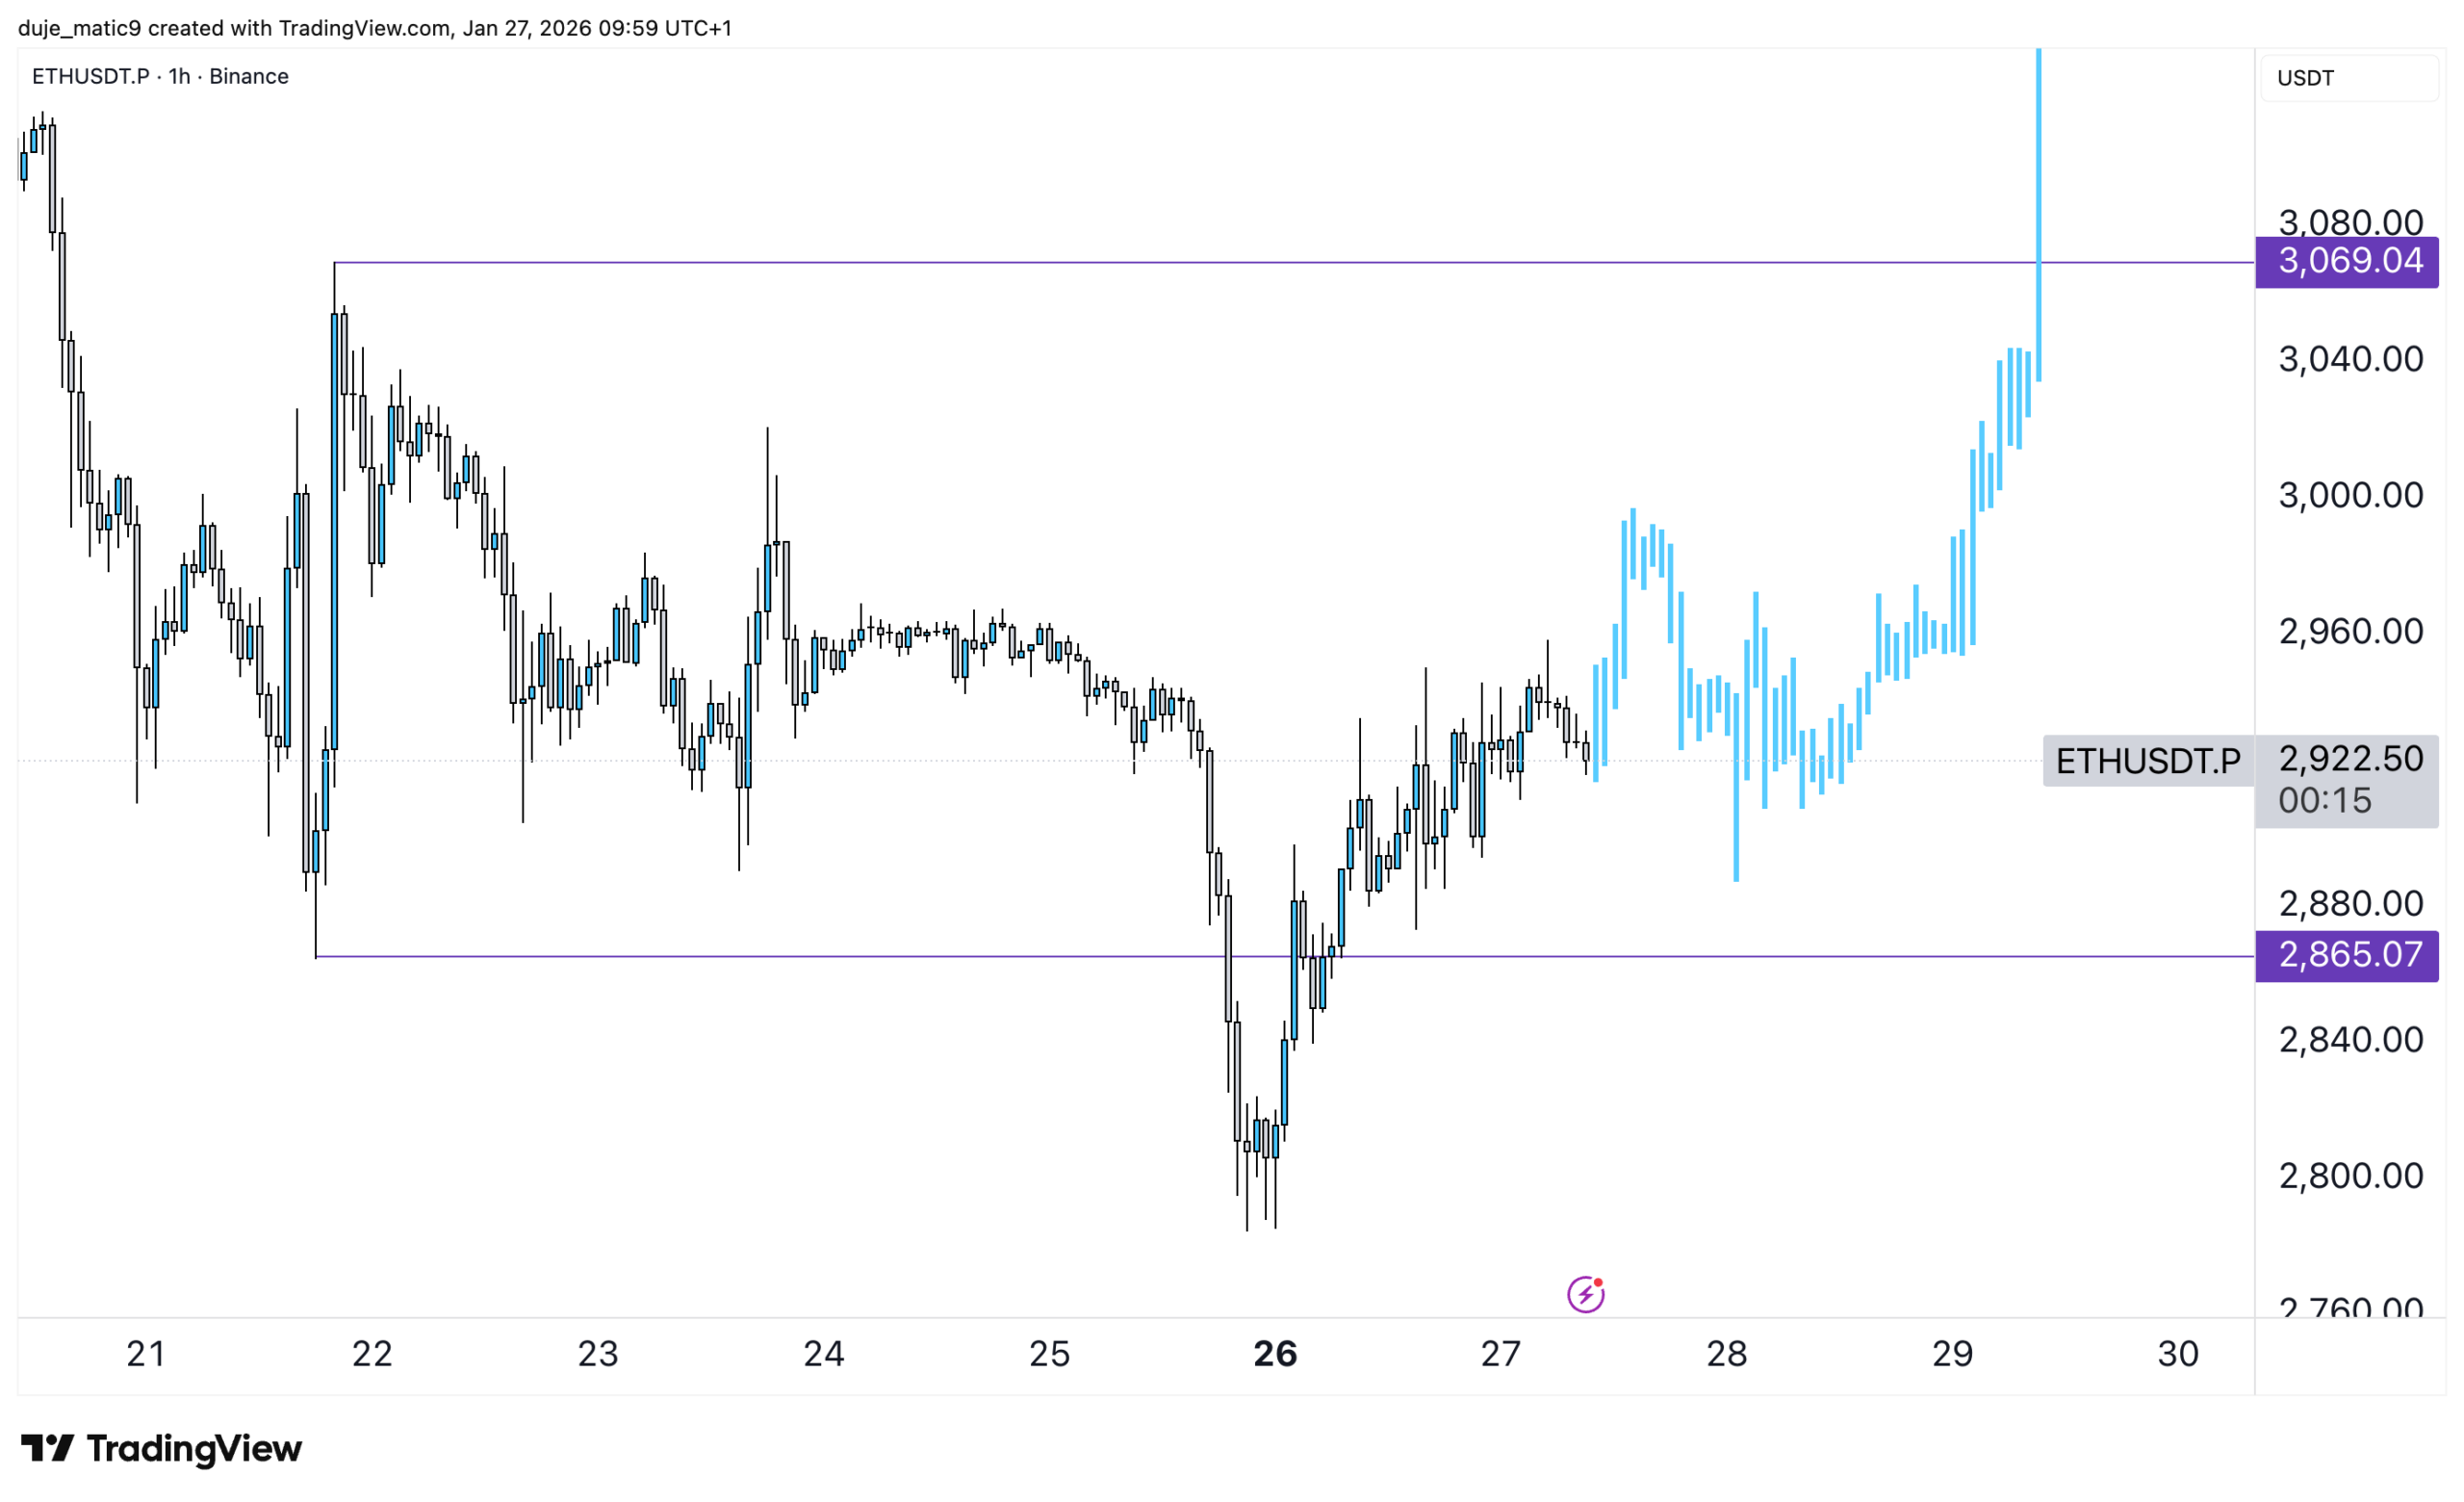
The 1 hour chart highlighted a defined trading range, with support near $2,865 and resistance around $3,069.
Earlier price action stayed inside this zone before a sharp breakdown pushed ETH into the low $2,800s.
After that drop, ETH rebounded and moved back toward the former range. Subsequent candles showed price pressing higher toward the upper boundary, suggesting a retest of the prior resistance area rather than continued weakness.
Disclosure:This article does not contain investment advice or recommendations. Every investment and trading move involves risk, and readers should conduct their own research when making a decision.
Kriptoworld.com accepts no liability for any errors in the articles or for any financial loss resulting from incorrect information.

Tatevik Avetisyan is an editor at Kriptoworld who covers emerging crypto trends, blockchain innovation, and altcoin developments. She is passionate about breaking down complex stories for a global audience and making digital finance more accessible.
📅 Published: January 29, 2026 • 🕓 Last updated: January 29, 2026
