


PEPE traded near 0.00000590 USDT on the 4 hour PEPEUSDT chart on Binance on Jan. 16, holding inside a downward sloping channel after a sharp early January run to the 0.0000070 area.
Price sat just below the 50 period EMA near 0.00000606, while the chart kept a clear ceiling above at 0.00000982 and a lower support marker at 0.00000441.
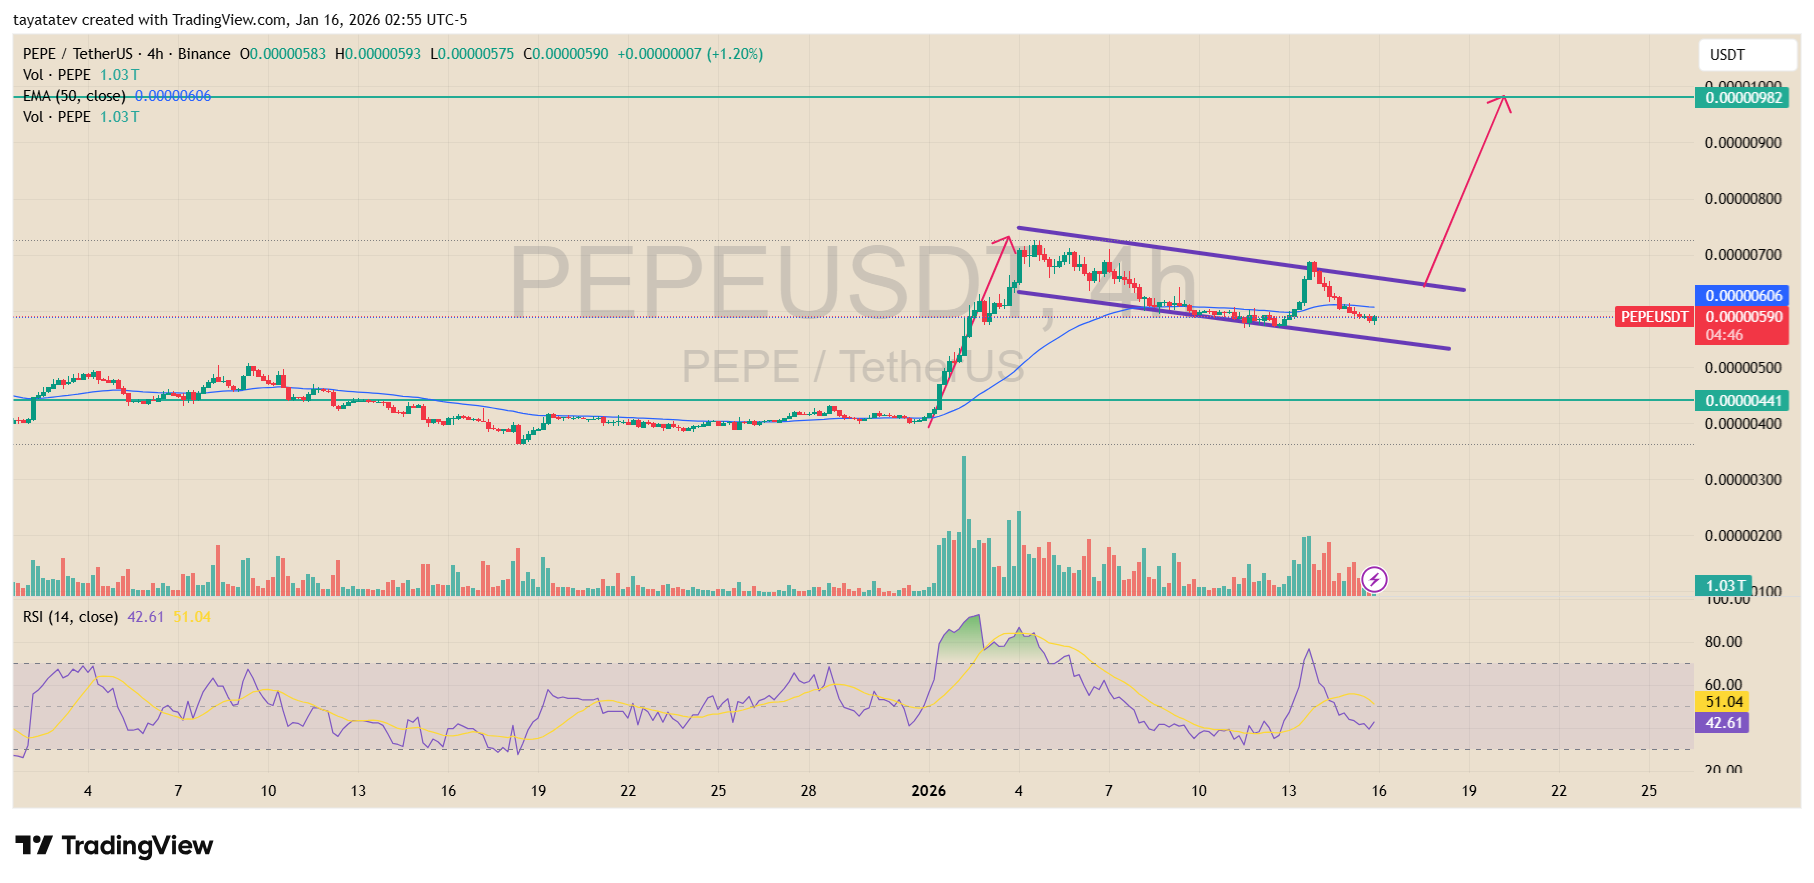
A bullish flag is a pattern where price surges, then drifts lower in a tight channel as the market consolidates before a possible continuation move.
On this setup, the flag formed between two purple trendlines that slope down, with multiple touches on both boundaries showing controlled pullbacks rather than a full reversal.
The pattern only confirms if price breaks above the flag’s upper trendline and holds, because the channel still points lower until that breakout happens.
A clean push through the upper boundary would also put price back above the 0.00000606 EMA line, which often acts as a quick trend filter on this timeframe.
If the breakout confirms, the chart’s marked objective sits near 0.00000982, which is about 66% above the current 0.00000590 level.
That target also matches the next visible overhead level on the right side of the chart, so it doubles as a technical destination and a prior supply zone.
Momentum stayed mixed. The 14 period RSI sat near 42.61, which kept it below the midpoint and showed that the pullback cooled the earlier rally.
Volume spiked on the initial run up, then faded during the flag, which fits the usual flag structure where activity drops during consolidation and can return on a breakout.
If price fails to reclaim the upper trendline, the lower flag boundary becomes the near term line to watch.
A break below that support would weaken the bullish flag read and shift attention to the wider downside level near 0.00000441, which is the next clear support band shown on the chart.
Stay ahead in the crypto world – follow us on X for the latest updates, insights, and trends!🚀
PEPE weekly chart shows falling wedge breakout with measured upside
PEPE posted a sharp upside move on the weekly PEPE TetherUS chart on KuCoin, after breaking out of a falling wedge that had guided price lower for several months.
The breakout candle pushed price to around 0.00000675 USDT, marking one of the strongest weekly advances since late 2025.
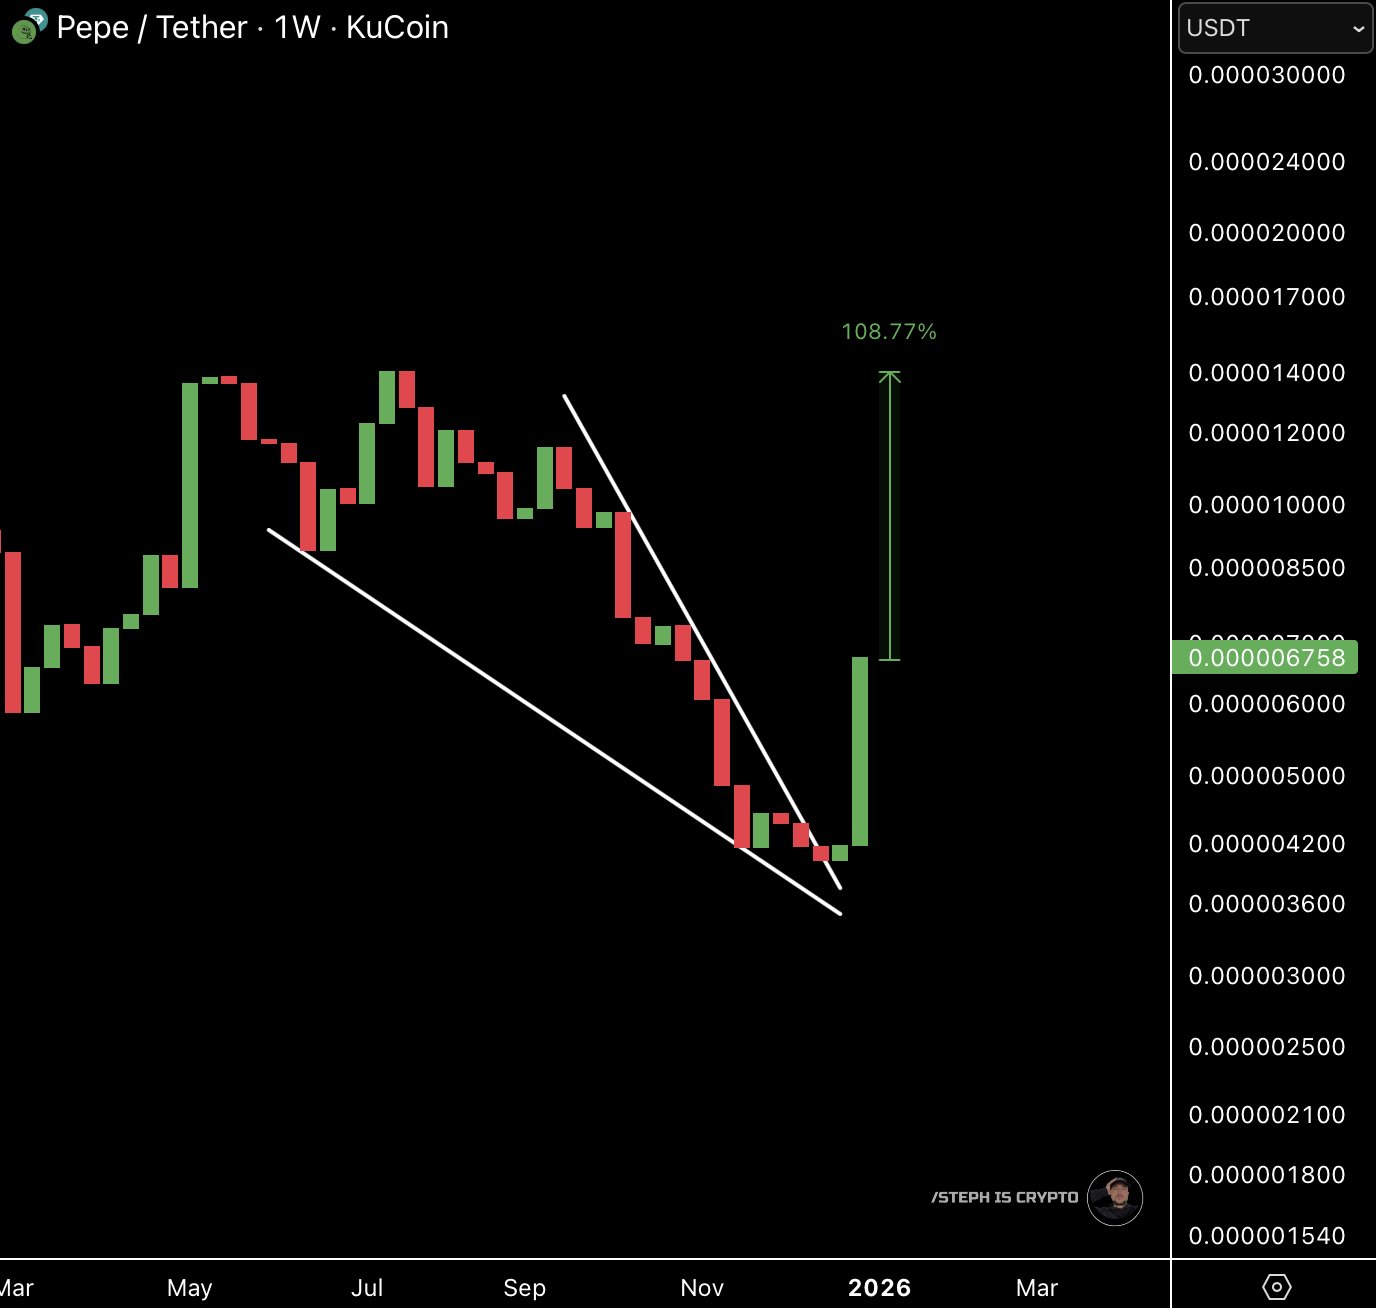
A falling wedge is a bullish reversal pattern where price trends lower inside converging trendlines, then breaks higher once selling pressure fades.
On this chart, PEPE respected both downward sloping boundaries through mid and late 2025, printing lower highs and lower lows before compressing near the wedge apex.
The breakout occurred as price closed decisively above the upper wedge trendline, followed by a large green weekly candle. That move confirmed the pattern and signaled a shift in market structure from compression to expansion.
The size of the breakout candle also showed strong follow through, rather than a shallow probe above resistance.
Based on the wedge height projected from the breakout point, the measured move points to a potential upside of roughly 108% from the breakout zone.
That projection places the technical target near the 0.00001400 area, which also lines up with a prior price region from earlier in the cycle where trading activity previously clustered.
The structure matters because the breakout came after a prolonged decline, not during a sideways range. That context increases the technical weight of the move, as falling wedges on higher timeframes often mark trend reversals rather than short term continuations.
If price holds above the former wedge resistance on weekly closes, the breakout structure remains intact.
A failure back below that trendline would weaken the setup, but as long as price stays above it, the chart keeps the 108% upside projection in focus as the primary technical objective.
Disclosure:This article does not contain investment advice or recommendations. Every investment and trading move involves risk, and readers should conduct their own research when making a decision.
Kriptoworld.com accepts no liability for any errors in the articles or for any financial loss resulting from incorrect information.

Tatevik Avetisyan is an editor at Kriptoworld who covers emerging crypto trends, blockchain innovation, and altcoin developments. She is passionate about breaking down complex stories for a global audience and making digital finance more accessible.
📅 Published: January 16, 2026 • 🕓 Last updated: January 16, 2026
