

Sapien (SAPIEN) surged sharply today, climbing over 150 % in a single session.
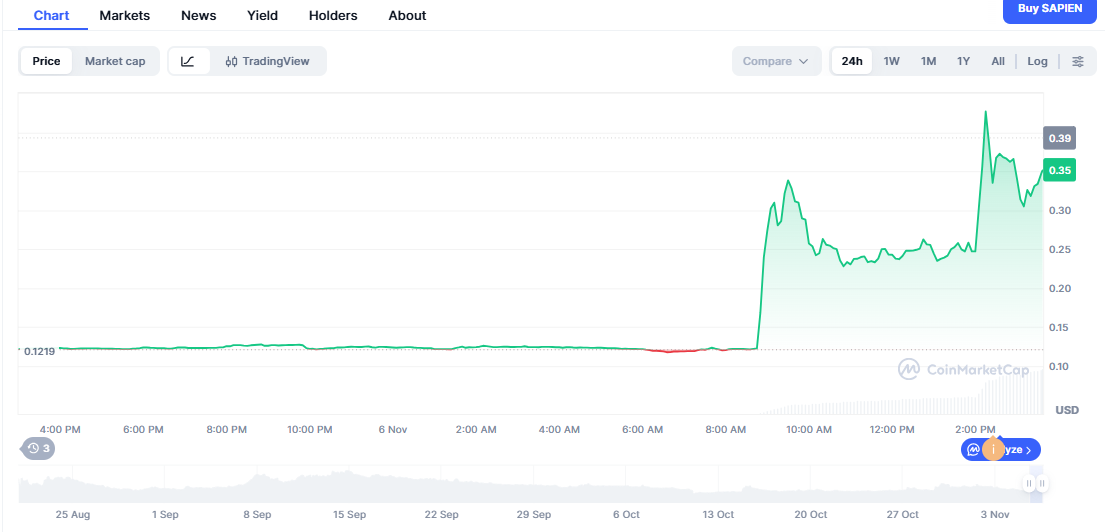
The spike came after the project confirmed a major Binance listing and announced an airdrop of 15 million tokens to existing holders. Trading volumes jumped across multiple exchanges, signaling strong market interest. The surge placed SAPIEN among the most talked-about altcoins, drawing attention from traders seeking exposure to fast-growing AI-related networks.

Sapien jumps after Binance listing, Foundation launch, and 1.2M users
The rally followed a series of ecosystem updates rather than speculative hype alone. The newly formed Sapien Foundation unveiled plans to oversee protocol governance and open infrastructure for its crowdsourced AI data platform. The team revealed milestones of over 1.2 million registered users and 100 million completed tasks in under eight months, highlighting real-world traction. These developments positioned SAPIEN as more than a short-term listing play, connecting it with tangible utility and partnerships in data-training industries.
Growing community engagement also fueled momentum. Sapien launched the Sapien Squad campaign for Base-chain users, rewarding contributors with NFT badges and future airdrop eligibility. That outreach strengthened its presence in Web3 social and AI data sectors, adding to the project’s visibility. As on-chain participation increased, traders interpreted the surge as both a reaction to listing news and recognition of sustained ecosystem growth.
Sapien Faces Cooling Phase After Sharp Rally, Charts Hint at Rebound Setup
Sapien’s recent breakout may face a temporary pause after days of strong gains. The 4-hour chart shared by trader @Satori_btc shows SAPIEN reaching the upper Bollinger Band, signaling stretched momentum. The token surged above key resistance near $0.12, flipping it into short-term support. This move triggered overbought conditions on the RSI, suggesting that price could pull back before stabilizing.
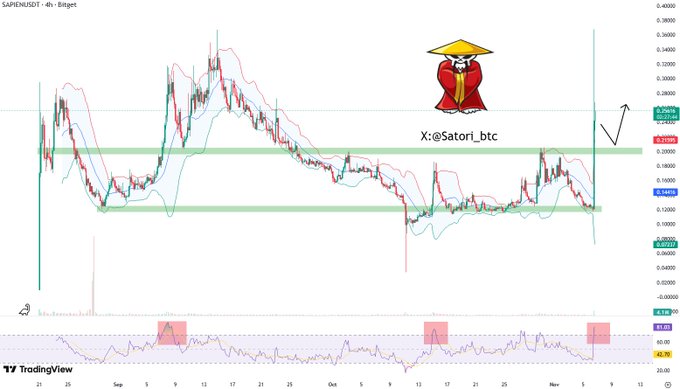
In the past, SAPIEN’s RSI reversals at similar levels have led to short-term dips followed by renewed buying. The green zones on Satori’s chart highlight these previous accumulation areas. The analyst expects a mild retracement toward that support band before another potential rebound. This structure aligns with typical post-rally consolidation patterns, where price resets indicators before resuming the trend.
Overall, the technical setup shows strength despite the overbought signal. Buyers defended every dip during the latest advance, indicating sustained demand. As long as price holds above the highlighted green zone, the broader momentum remains intact. Traders view the current phase as a cooldown rather than a reversal, with a potential rebound forming once short-term pressure eases.
Disclosure:This article does not contain investment advice or recommendations. Every investment and trading move involves risk, and readers should conduct their own research when making a decision.
Kriptoworld.com accepts no liability for any errors in the articles or for any financial loss resulting from incorrect information.

Tatevik Avetisyan is an editor at Kriptoworld who covers emerging crypto trends, blockchain innovation, and altcoin developments. She is passionate about breaking down complex stories for a global audience and making digital finance more accessible.
📅 Published: November 6, 2025 • 🕓 Last updated: November 6, 2025
