


SHIB traded in a clear downtrend on the 4 hour SHIBUSD chart from TradingView Coinbase, with price sitting below the 50 period EMA.
The latest candle showed SHIB near $0.00000760, down about 0.26% on the session, while the 50 EMA tracked higher around $0.00000782.
Stay ahead in the crypto world – follow us on X for the latest updates, insights, and trends!🚀
That gap matters because it shows sellers still control the short term trend, even after small bounces.
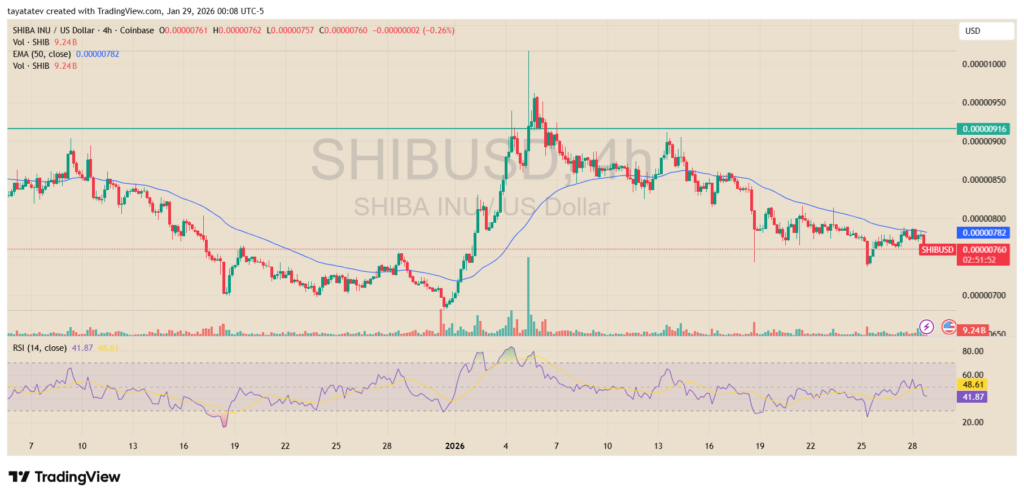
Price action also shows a series of lower highs after the early January surge. SHIB spiked above the $0.00000900 area and briefly pushed toward the $0.00001000 zone, then it rolled over and spent most of the month grinding lower. Since then, rebounds have looked smaller and have faded faster, which keeps the structure pointed down.
At the same time, SHIB has started to move sideways near the recent lows, but the chart still reads as consolidation inside a broader decline, not a confirmed turn.
RSI sat near 41.9, which signals weak momentum rather than a strong recovery. It is not deeply oversold, so the chart does not show a clear “snap back” setup yet.
For a reversal setup, the chart needs a cleaner reclaim of resistance. First, SHIB would need to climb back above the 50 EMA near $0.00000782 and hold it on closes, not just wick through it.
After that, the bigger test sits at the green horizontal line near $0.00000916.
A sustained break and close above that level would signal that buyers have started to flip prior resistance into support, which is usually the kind of shift technicians look for when a downtrend begins to change.
Until that happens, the chart keeps the burden on buyers. The market is still trading below the main resistance levels, and the downtrend remains the default read while SHIB holds under the EMA and the $0.00000916 line.
SHIB tests weekly support as downtrend pressure eases
Shiba Inu hovered near a major weekly support zone after a prolonged decline, raising attention to whether the meme token can stabilize and attempt a rebound, according to a weekly SHIBUSDT chart shared by TheCryptoBasic and based on TradingView data.
The chart showed SHIB trading around $0.0000077 after sliding steadily through most of 2025.
Price action remained inside a long-term descending channel, marked by lower highs and persistent selling pressure.
However, the latest candles formed directly above a clearly defined weekly support band, a level that has previously slowed declines and triggered short-term bounces.
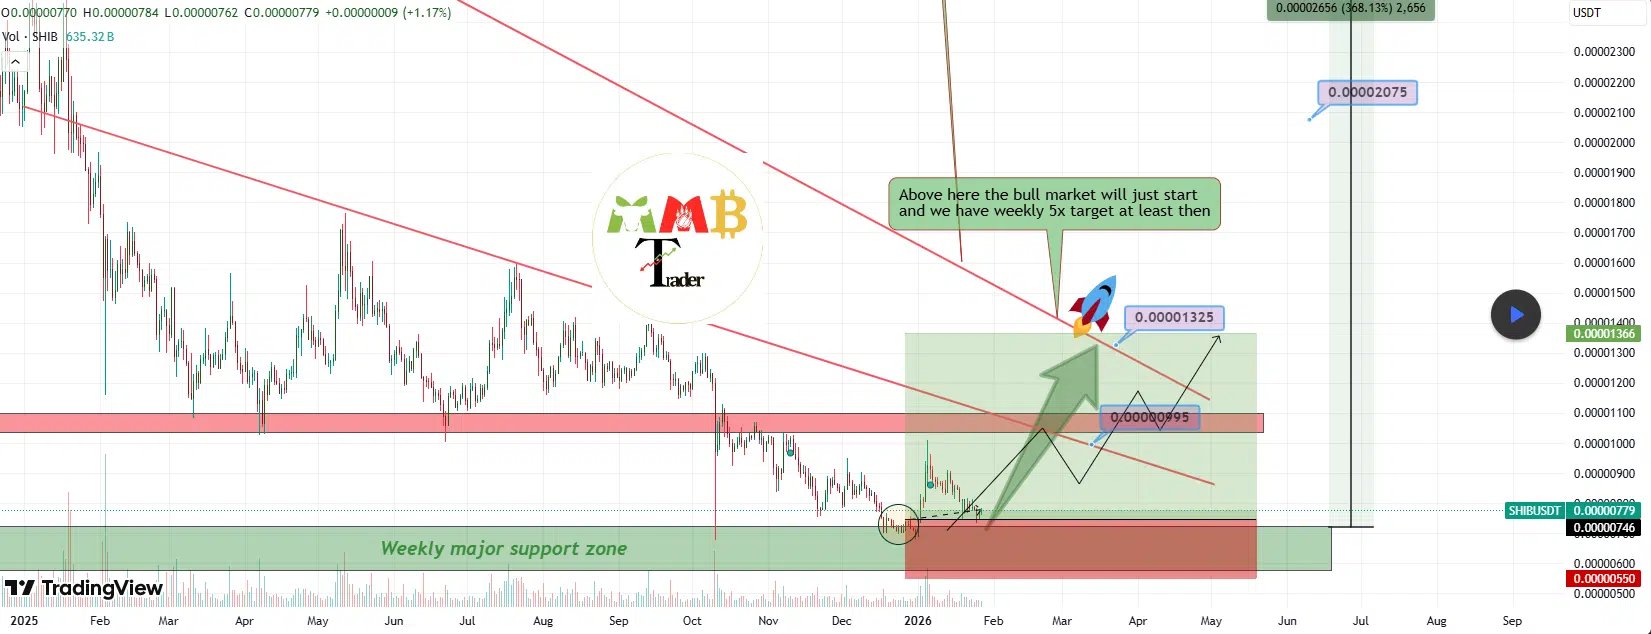
Technically, SHIB remains in a downtrend. The red diagonal trend lines on the chart show that sellers have controlled rallies for months, while price repeatedly failed to break above descending resistance.
Even so, the current structure suggests downside momentum has weakened as SHIB trades sideways near support instead of extending losses sharply lower.
The support zone highlighted on the chart sits just above the $0.0000070 area. Price has reacted to this zone before, and the current consolidation shows buyers defending it again.
As a result, the market has entered a decision phase, where continuation lower or a relief rally becomes more likely.
For a bullish shift to develop, the chart points to a clear condition. SHIB would need to break above the descending trend line and reclaim the red resistance band near $0.00000995.
A sustained move above that area would signal that sellers are losing control of the broader structure.
From there, the next upside reference on the chart stands near $0.00001325, which implies a potential move of roughly 80% from current levels if momentum builds.
Until such a breakout occurs, the broader trend remains intact. The chart shows that SHIB is still trading below long-term resistance, and any upside attempt would first need confirmation through higher highs and stronger follow-through.
For now, the market is watching whether the weekly support continues to hold and whether price can push decisively out of the descending channel.
Disclosure:This article does not contain investment advice or recommendations. Every investment and trading move involves risk, and readers should conduct their own research when making a decision.
Kriptoworld.com accepts no liability for any errors in the articles or for any financial loss resulting from incorrect information.

Tatevik Avetisyan is an editor at Kriptoworld who covers emerging crypto trends, blockchain innovation, and altcoin developments. She is passionate about breaking down complex stories for a global audience and making digital finance more accessible.
📅 Published: January 29, 2026 • 🕓 Last updated: January 29, 2026
