SHIB Rebound Lacks Confirmation as Price Tests Key Weekly Support at 0.0000066721

-

Shiba Inu’s price extended its decline before staging a modest rebound, leaving the broader trend tilted to the downside unless key levels flip to support.

On the four hour chart, SHIB USDT fell sharply into early February after failing to hold above its short term range.

Stay ahead in the crypto world – follow us on X for the latest updates, insights, and trends!🚀

Price dropped toward the 0.0000065 area, where buyers stepped in and triggered a quick bounce.

As of the latest session, SHIB trades near 0.00000688, up slightly on the candle but still below major resistance levels, according to data from TradingView.

SHIB / TetherUS 4HSource: TradingView
SHIB / TetherUS 4H. Source: TradingView

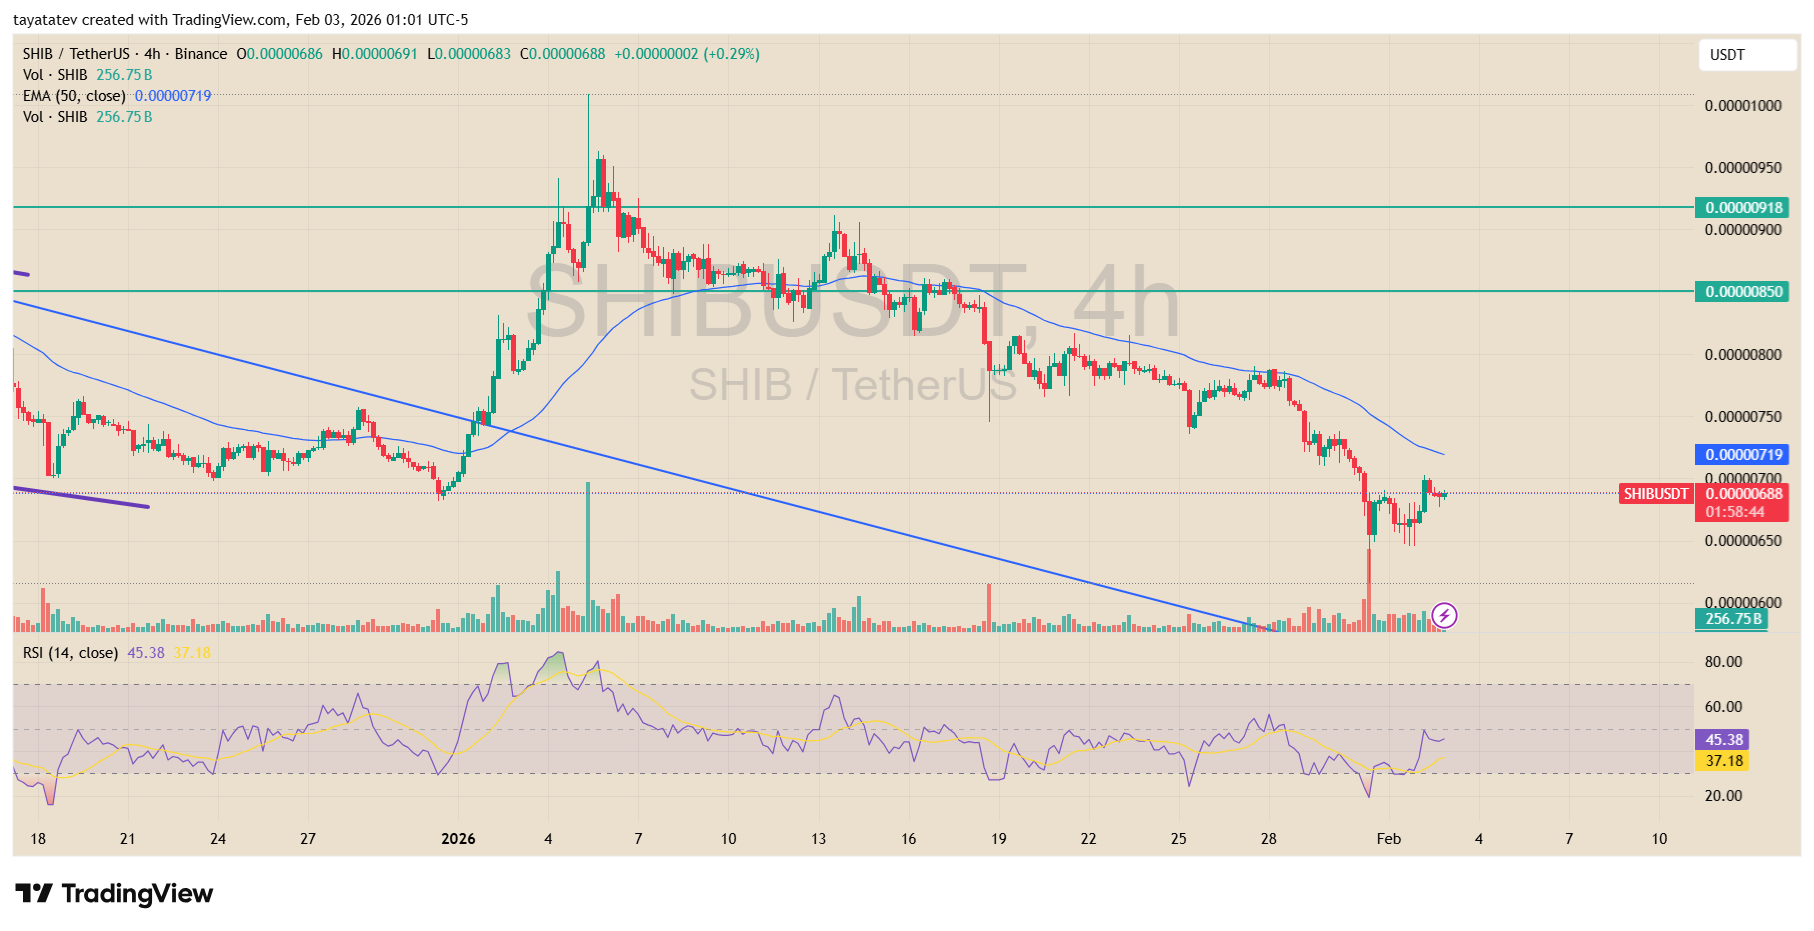
The recent move followed weeks of lower highs. After peaking near 0.0000095 in early January, SHIB rolled over and continued to fade beneath its declining 50 period exponential moving average, now near 0.00000719. That level has capped upside attempts and continues to define the short term trend.

Volume confirms the pressure. Selling activity expanded during the sharp drop into the February low, while the rebound occurred on comparatively lighter volume. This pattern suggests short covering rather than a clear shift in control.

Momentum indicators remain mixed. The relative strength index has recovered from oversold territory and now sits in the mid 40s.

That rebound signals easing downside momentum, yet it does not confirm a trend change. RSI remains below the neutral 50 line, keeping momentum biased lower.

For the structure to turn constructive, SHIB needs to reclaim the first green resistance zone near 0.0000072 to 0.0000075 and hold above it.

A sustained move above the 50 EMA, followed by acceptance above the 0.0000085 area, would signal that buyers are regaining control and that a broader reversal is underway.

Until that happens, the chart still reflects a downtrend. Failure to push through the initial resistance would leave SHIB vulnerable to another test of the recent lows.

A breakdown below the 0.0000065 support zone would reinforce bearish continuation and reopen the path toward deeper downside levels.

In short, SHIB has bounced from a local low, but confirmation remains absent.

The next move toward the first green resistance will decide whether the rebound develops into a reversal or fades back into the prevailing downtrend.

kripto.NEWS 💥
The fastest crypto news aggregator
200+ crypto updates daily. Multilingual & instant.
Visit Site

SHIB Faces Make or Break Weekly Support at 0.0000066721

Shiba Inu’s weekly chart is pressing into a make or break support zone after months of lower highs pulled price back toward the 0.0000066721 level highlighted by Ali Charts.

The chart shows SHIB rolling over after failing to hold the mid range near 0.0000148062, then sliding steadily into early 2026.

That drop kept price pinned near the lower boundary of the broader weekly structure, with the latest candles clustering just above the 0.0000066721 support line.

SHIB Weekly ChartSource: Ali Charts via X
SHIB Weekly Chart: Source: Ali Charts via X

This support now sets the near term direction. If SHIB holds above 0.0000066721 and starts printing higher weekly closes, the next test shifts back to the 0.0000148062 zone.

A reclaim of that level would mark the first meaningful reversal signal on this view, because it would move price back into the prior range instead of leaking lower from the floor.

If SHIB loses 0.0000066721 on a weekly close, the chart points to a deeper downside path. The next marked levels sit near 0.0000029954, and then 0.0000013522 below that, which would extend the downtrend and confirm a breakdown from the current base.

In short, the weekly setup stays bearish while SHIB trades at the bottom of the range.

Bulls need a clean hold above 0.0000066721 first, and then a push back through 0.0000148062 to shift the structure.

kripto.NEWS 💥
The fastest crypto news aggregator
200+ crypto updates daily. Multilingual & instant.
Visit Site

Tatevik Avetisyan
Tatevik Avetisyan
Editor at Kriptoworld
LinkedIn | X (Twitter)

Tatevik Avetisyan is an editor at Kriptoworld who covers emerging crypto trends, blockchain innovation, and altcoin developments. She is passionate about breaking down complex stories for a global audience and making digital finance more accessible.

📅 Published: February 3, 2026 • 🕓 Last updated: February 3, 2026

LATEST POSTS

Bitcoin Cracks Over Weekend as Price Tests Saylor Cost Basis Near $75K

Bitcoin fell sharply over the weekend, extending its recent downtrend and breaking below several technical levels on the daily chart. On the Bitstamp feed, BTC...

Dogecoin Slips Below $0.116 as Analysts Map Path to $0.70 on Long Term Mini Cycle Trend

Dogecoin fell to fresh short term lows on Thursday as selling pressure pushed price below a key support zone on the 4 hour chart, extending...

Bitcoin’s Brutal Cycle Warning: Can BTC Really Sink to $32,000?

Bitcoin sold off hard in the last 24 hours, sliding from the $88,000–$89,000 area and then breaking down fast toward $82,700 on the 4 hour...

Ether Traders Flag Key Range as Price Returns to $3,000 Zone

An X user who posts under the handle Tryrex said he placed a limit short setup on Ether, pointing to a price zone where ETH...
119FollowersFollow

Most Popular

Guest posts