


Nov. 26, 2025 – Solana (SOL) is trading around 139 dollars on the 4-hour Coinbase chart after breaking a multiweek descending trendline and reclaiming its 50-period exponential moving average near 135.67 dollars.
The breakout shifts the short-term structure into an uptrend, with higher lows forming from the mid-November bottom and buyers now pressing into a heavy resistance band just above spot.
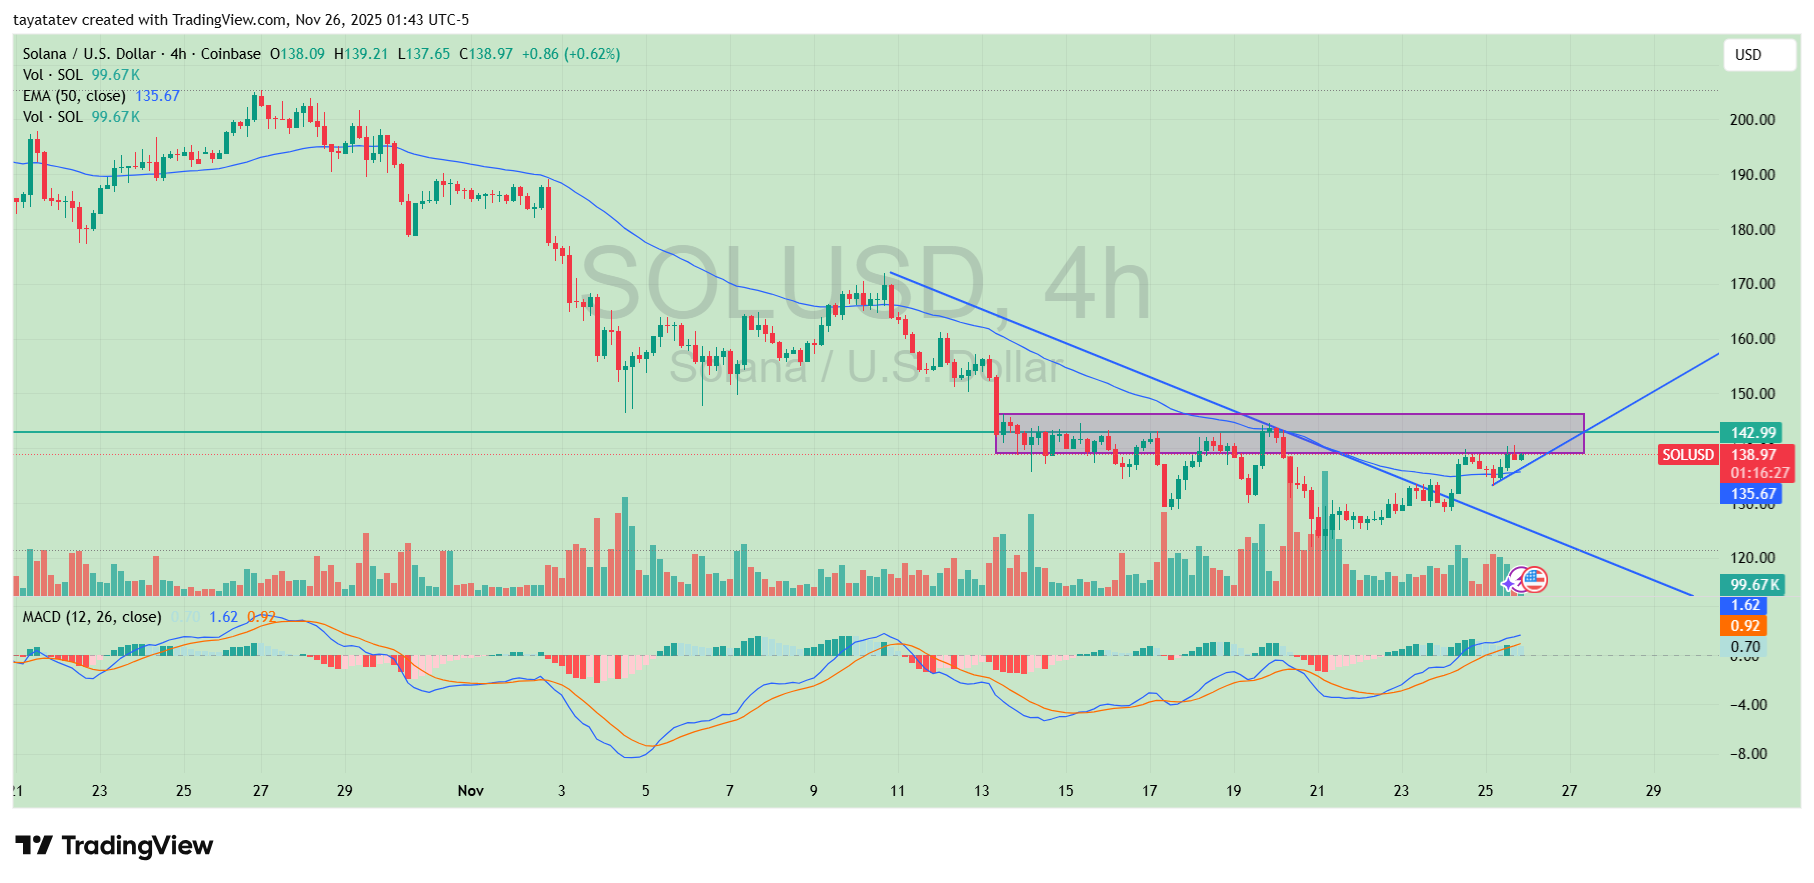
After the downtrend that started from the early-November high, SOL finally pushed through the falling trendline during the Nov. 25 sessions and held above it on the next candles.
At the same time, price flipped the 50-EMA from resistance into support, which now acts as the first line of defense for bulls around 135–136 dollars.
As long as candles continue to close above both the broken trendline and the 50-EMA, the chart shows a constructive upward bias.
However, the horizontal supply zone between roughly 142 and the mid-140s remains the main barrier.
The shaded box on the chart marks a prior consolidation area where repeated attempts to move higher failed earlier in November. For confirmation that this new uptrend can extend, SOL needs to close decisively above this 142–150 dollar zone and then hold it as support.
A successful breakout there would signal that buyers have absorbed the overhead sell orders and cleared the path for a larger move.
Momentum indicators currently support the bullish case. The MACD on the 4-hour timeframe has crossed above its signal line, while the histogram prints positive bars, showing strengthening upside momentum.
In addition, buying volume has picked up during the move off the recent lows, which backs the idea that real demand is driving the trendline break rather than a thin bounce.
If bulls force a clean close above the resistance band and keep price above 142 dollars, the next technical objective sits near the 170 dollar region.
That target lines up with a previous reaction area and the upper boundary of the rising channel drawn from the recent low.
By contrast, a drop back below the 50-EMA and the broken trendline would weaken the bullish structure and put the 130–132 dollar zone back in focus as support.
Solana Bitcoin Pair Shows Rounded Bottom Near Key Support
Nov. 26, 2025 – The SOL/BTC pair is holding above a major support band after printing a rounded bottom on the 4-hour Binance chart shared by trader Gordon (@GordonGekko) on X.
The pattern formed after repeated defenses of the lower horizontal zone, with wicks probing down and buyers stepping in to push price back into the range.
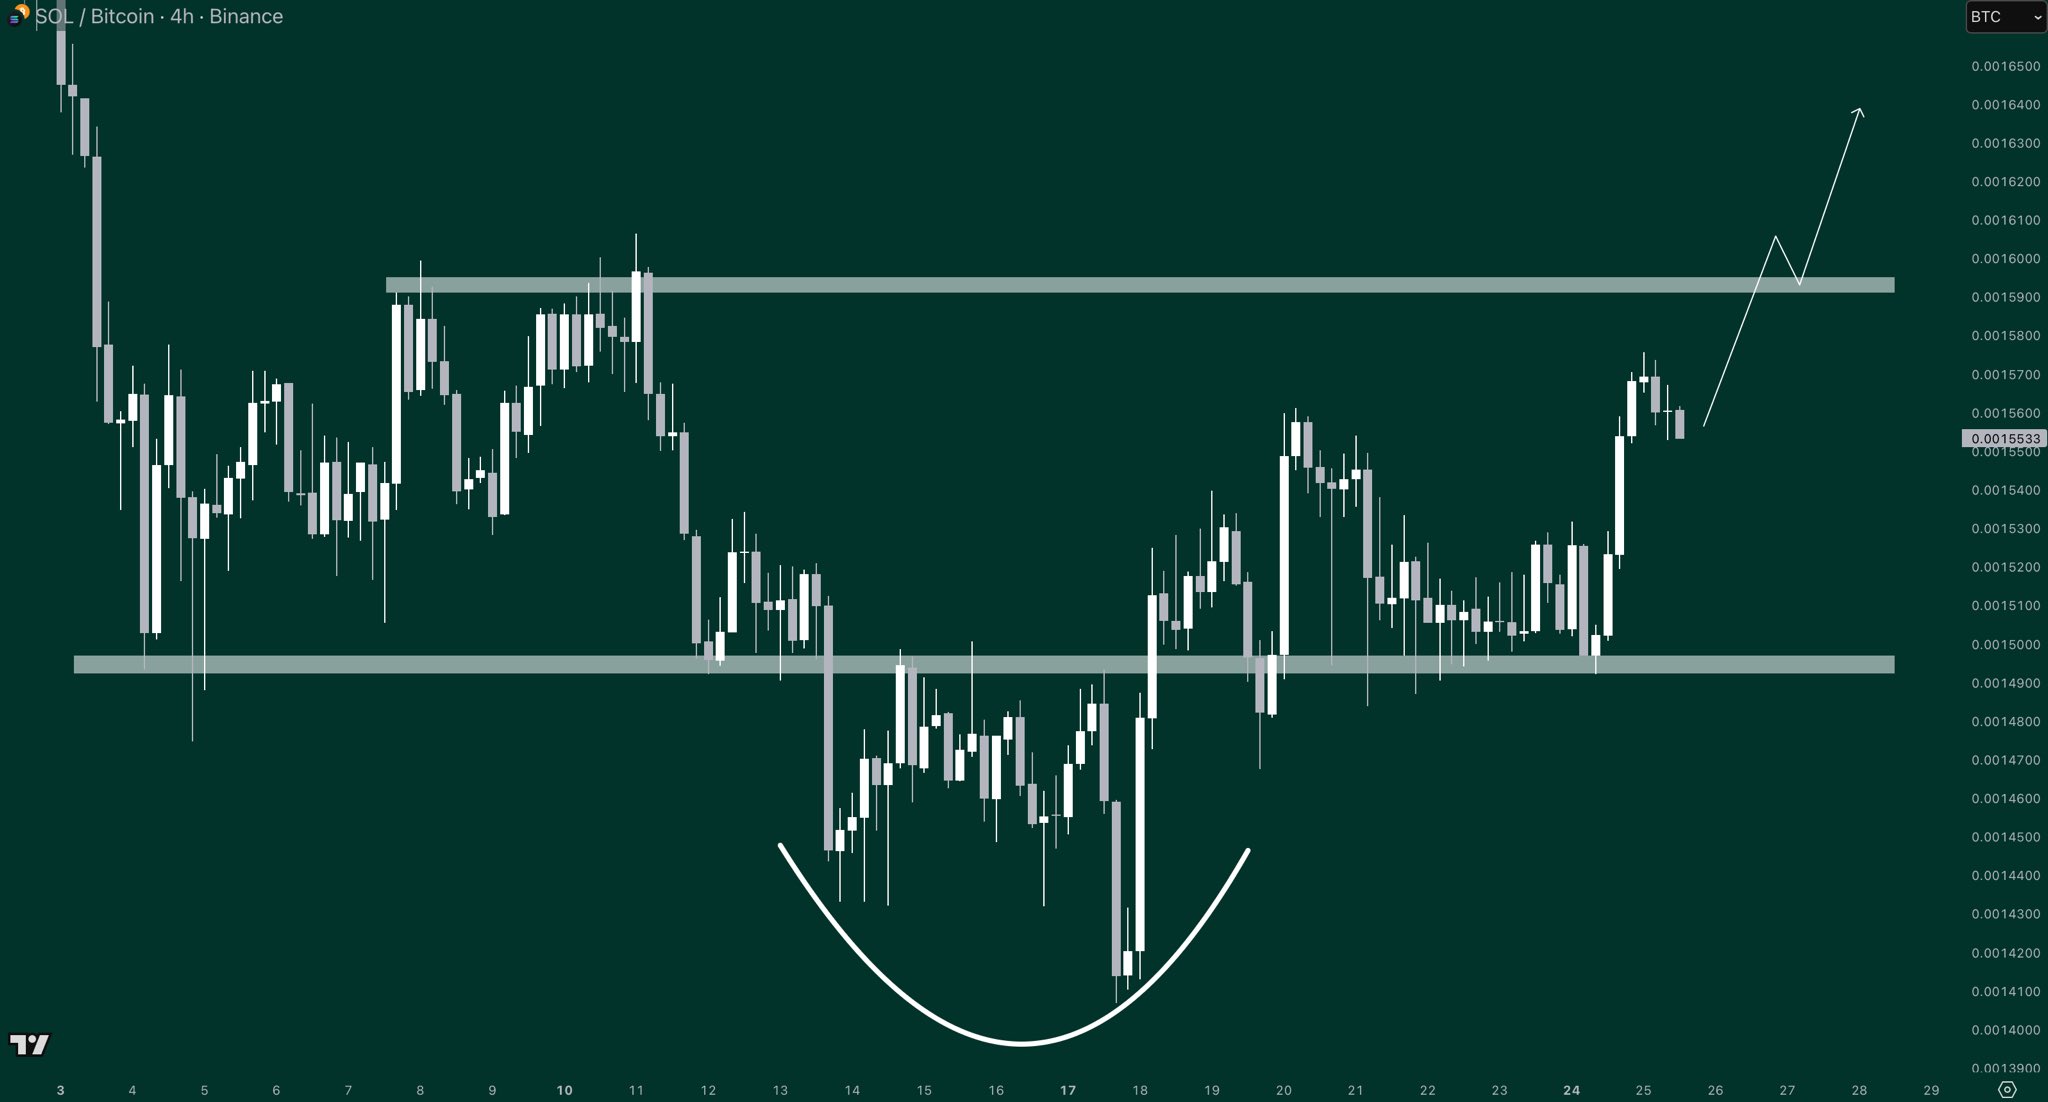
At the same time, candles are now pressing toward the upper resistance area highlighted on the chart, where SOL previously stalled against Bitcoin. Gordon captioned the setup “BOTTOM. Are you connecting the dots?,” pointing to the curved base and the projected path higher drawn on the image.
If SOL/BTC closes firmly above this upper band and then retests it as support, the breakout would confirm that the relative strength has shifted toward Solana, opening room for further upside against Bitcoin in this cycle.
Disclosure:This article does not contain investment advice or recommendations. Every investment and trading move involves risk, and readers should conduct their own research when making a decision.
Kriptoworld.com accepts no liability for any errors in the articles or for any financial loss resulting from incorrect information.

Tatevik Avetisyan is an editor at Kriptoworld who covers emerging crypto trends, blockchain innovation, and altcoin developments. She is passionate about breaking down complex stories for a global audience and making digital finance more accessible.
📅 Published: November 26, 2025 • 🕓 Last updated: November 26, 2025
