


A weekly Solana Tether chart shared by X user CryptoCurb shows SOL trading near $87.29 on Binance on Feb. 15, 2026, after slipping back toward a long rising support line.
The snapshot, created on TradingView, frames price action inside a broadening formation, often called a megaphone pattern, marked by two diverging trendlines that widen over time.
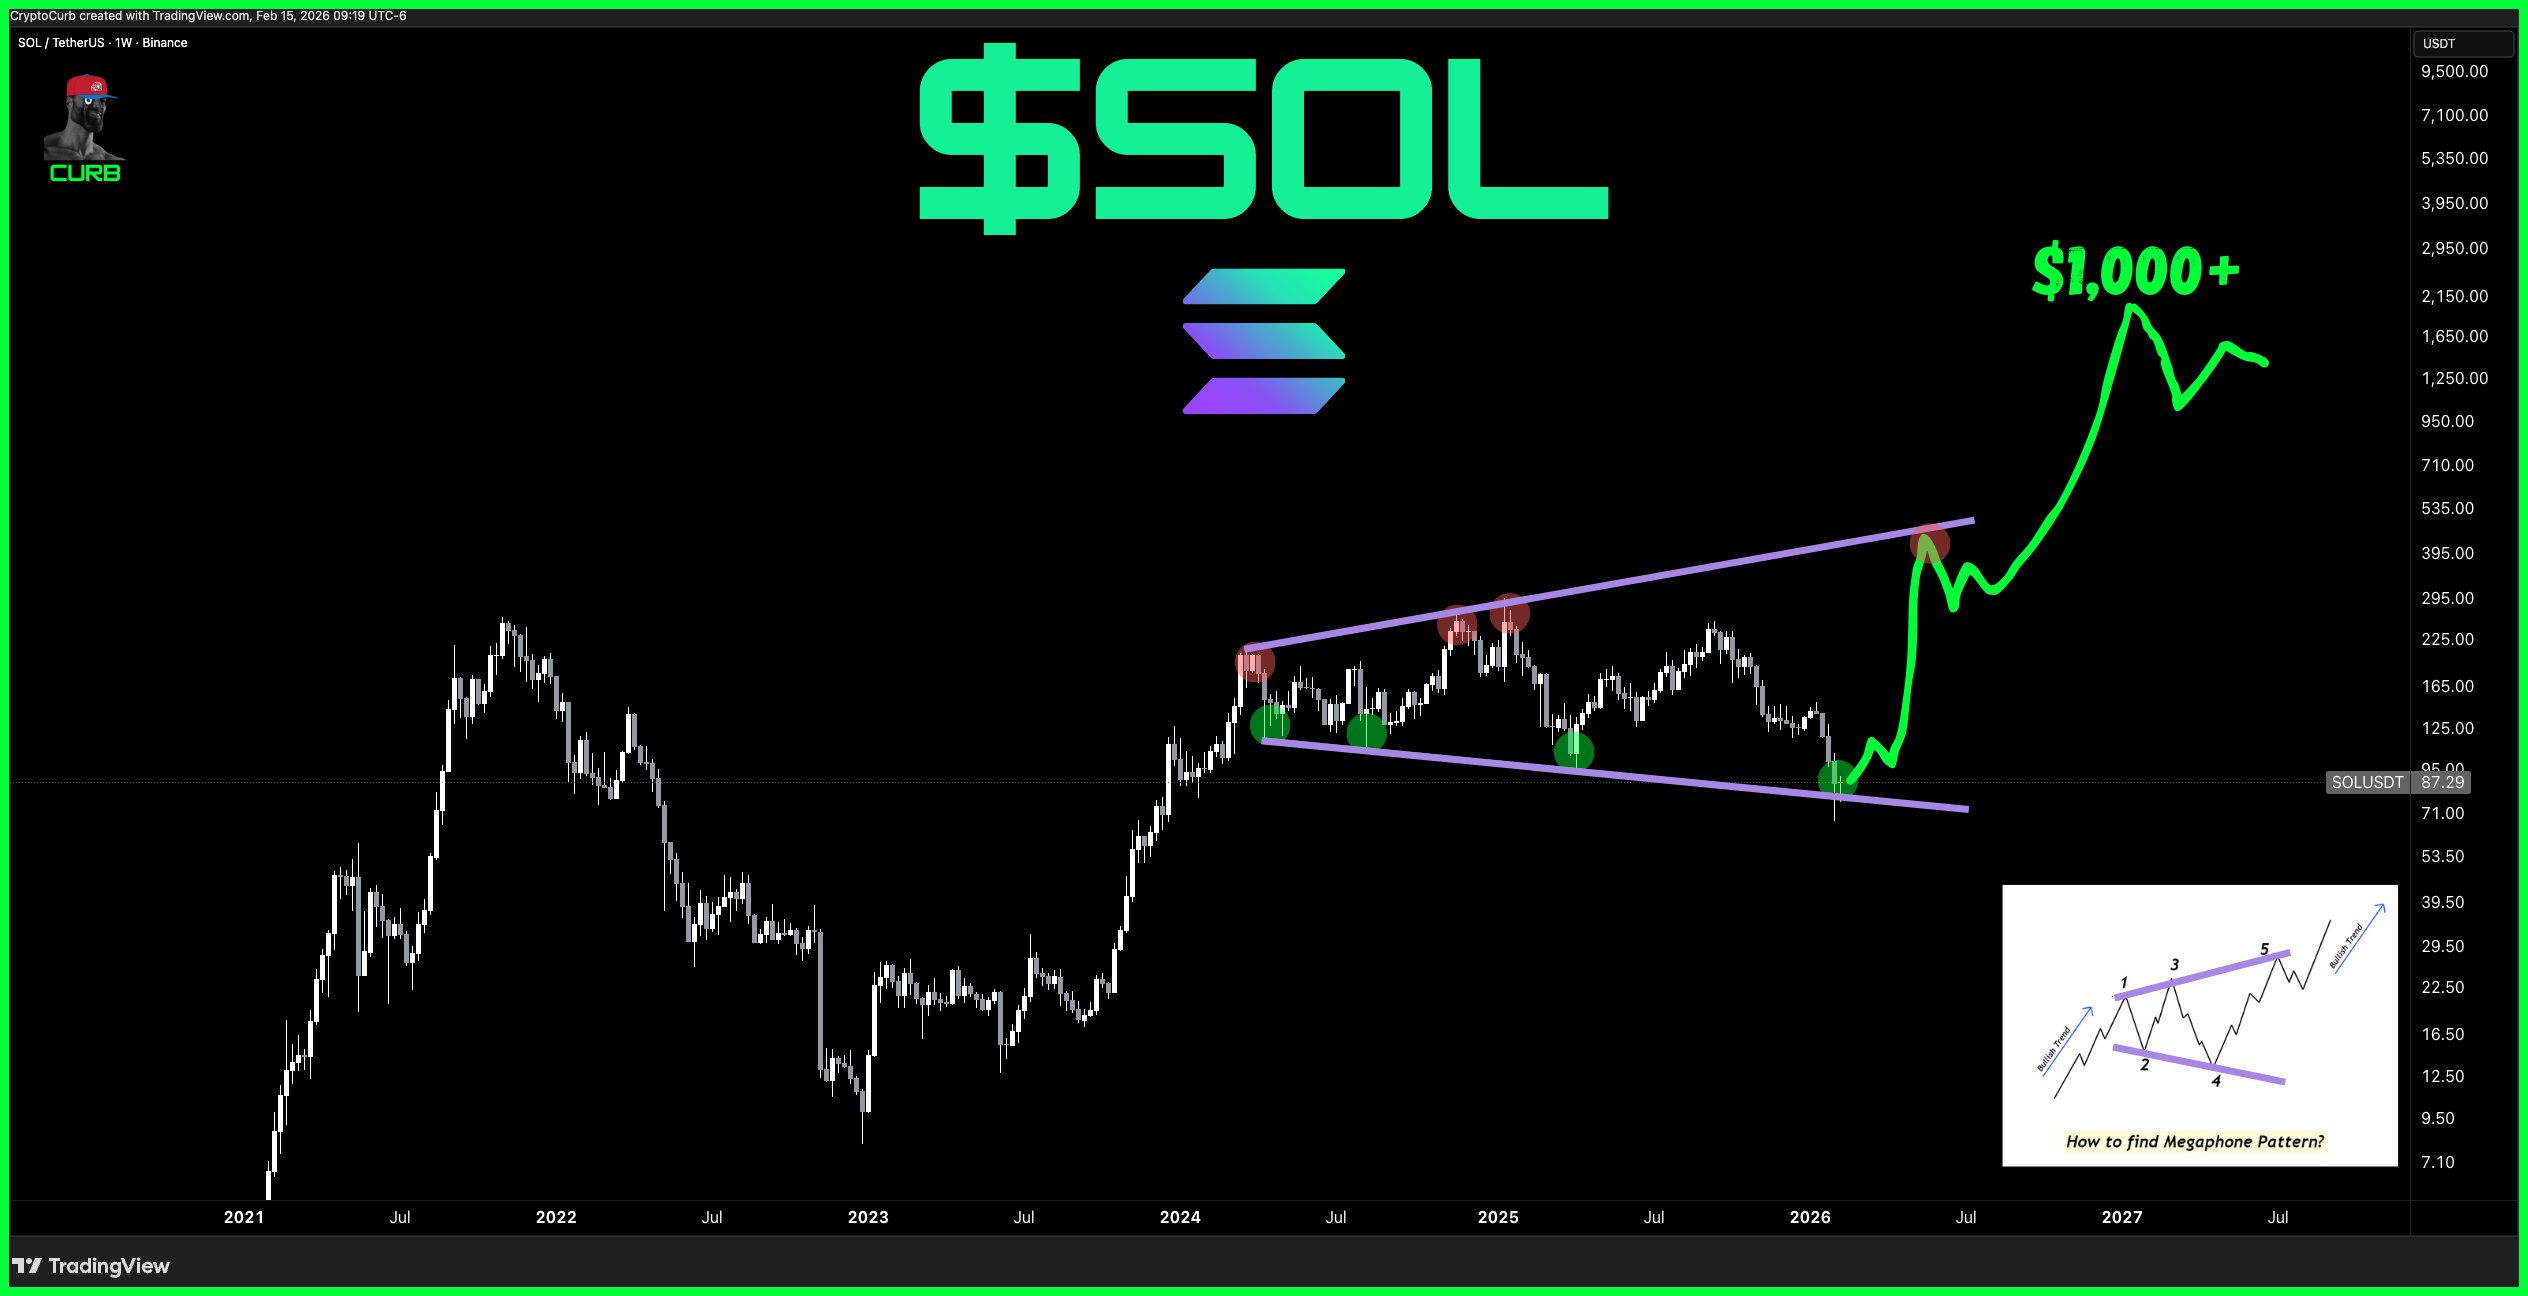
On the chart, CryptoCurb highlighted several prior swings that tagged the upper boundary and then reversed, using red markers near earlier highs.
The analyst also marked multiple dips that met the lower boundary with green markers, including the latest pullback into early 2026, where the lower line sits just under current price on the weekly timeline.
CryptoCurb then drew a projected move that starts with a rebound off the lower trendline, followed by a sharp climb through the mid range and a push into the upper boundary.
The sketch extends into 2027 and labels a potential move above $1,000, while the post caption said the setup “looks good” and added “send it,” alongside “SOLANA.”
Solana Extends Downtrend as Support Break Triggers Fresh Selloff
A daily Solana U.S. dollar chart shared on TradingView and created by user tayatatev on Feb. 16, 2026, showed price breaking below a short-term rising trendline that had guided the late-January bounce.
The loss of that trendline marked the end of a brief consolidation phase and coincided with a renewed downswing, reinforcing the broader bearish structure that has been in place since the November peak.
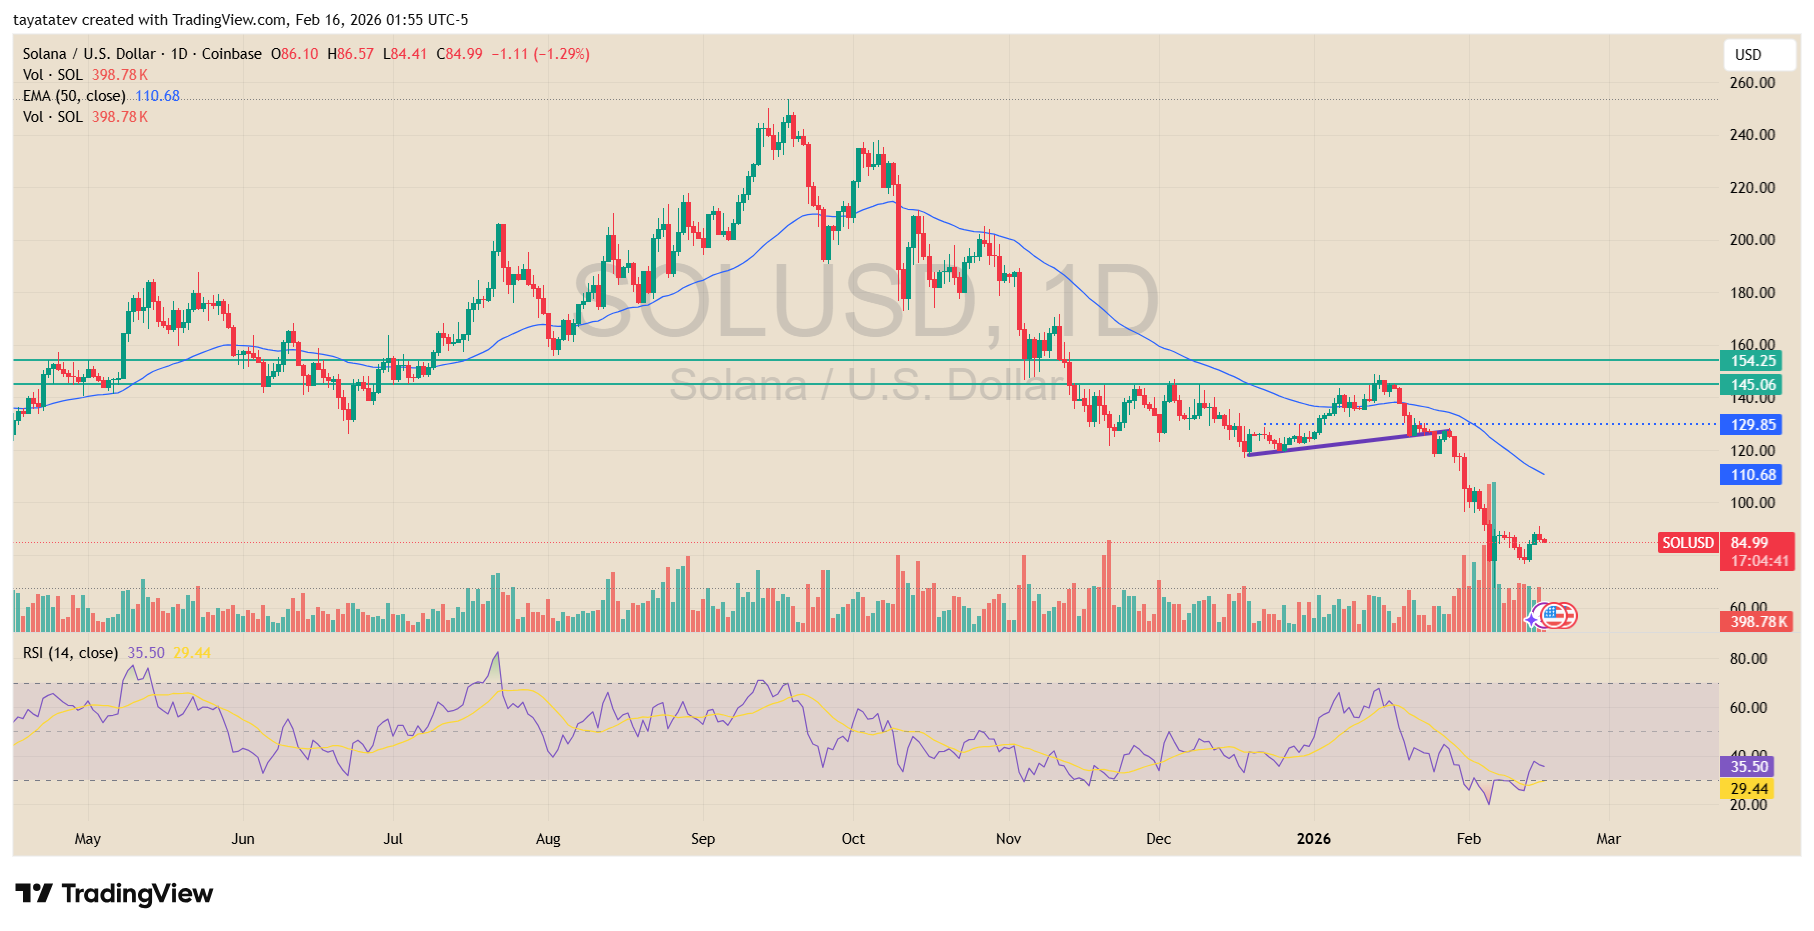
The chart showed Solana trading below its 50-day exponential moving average, which continued to slope lower and cap rebounds across recent weeks.
Earlier attempts to reclaim former support in the mid-$140s to mid-$150s zone failed, and that area now sits above price as overhead resistance.
The failure near that zone preceded the latest leg lower, which accelerated as selling pressure expanded during the breakdown.
Momentum indicators also weakened. The relative strength index on the daily timeframe stayed below the neutral 50 level and dipped toward oversold territory during the selloff, reflecting sustained downside pressure rather than a brief pullback.
Volume expanded during the sharp decline into mid-February, then eased on the bounce attempt, suggesting that sellers remained in control as the market worked through the recent breakdown.
Disclosure:This article does not contain investment advice or recommendations. Every investment and trading move involves risk, and readers should conduct their own research when making a decision.
Kriptoworld.com accepts no liability for any errors in the articles or for any financial loss resulting from incorrect information.

Tatevik Avetisyan is an editor at Kriptoworld who covers emerging crypto trends, blockchain innovation, and altcoin developments. She is passionate about breaking down complex stories for a global audience and making digital finance more accessible.
📅 Published: February 16, 2026 • 🕓 Last updated: February 16, 2026
