


Solana’s price slid sharply over the last session, extending a short-term pullback as selling pressure pushed the token toward a key technical area.
SOL fell by about $7 on the day, dropping from the mid-$135 zone to near $128, based on the four-hour SOL/USD chart from TradingView.
Stay ahead in the crypto world – follow us on X for the latest updates, insights, and trends!🚀
The move marked one of the steepest daily declines this week and followed a clear rejection from recent local highs.
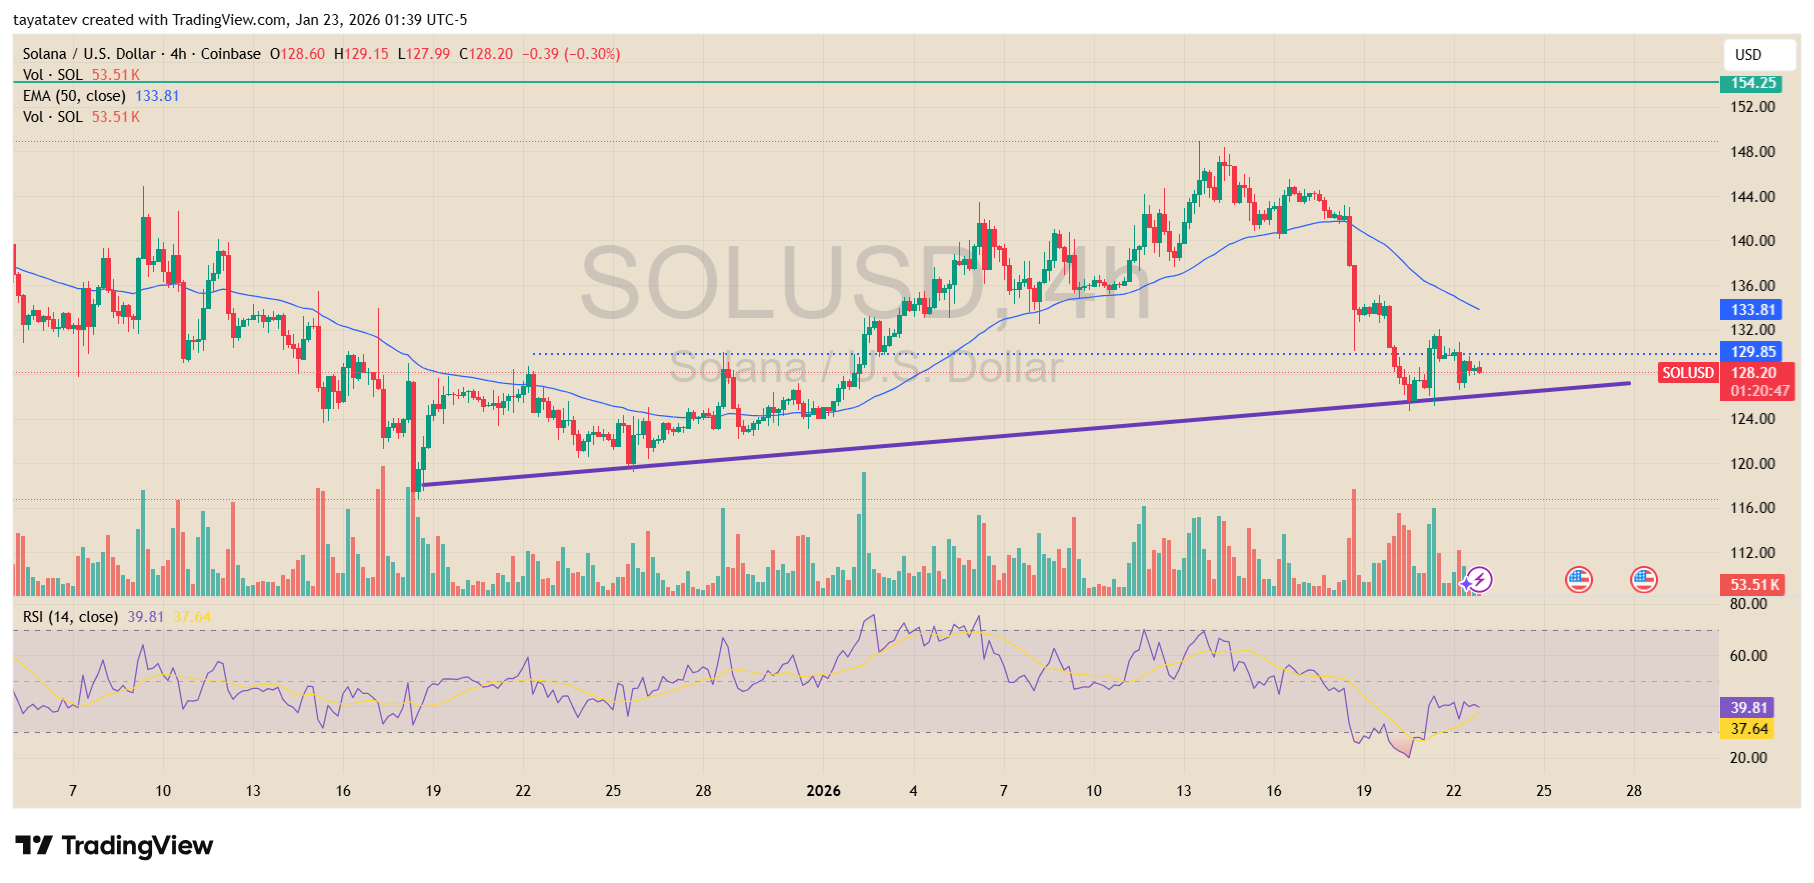
As a result, price moved back below the 50-period exponential moving average, which now sits near $134.
That shift signals a loss of short-term momentum after Solana failed to hold above the $140–$145 area earlier this month. At the same time, trading activity increased during the sell-off, showing stronger participation as price moved lower.
Despite the drop, SOL continues to trade just above a rising trendline that has guided price action since late December. This trendline currently aligns closely with the $128 zone, making it a critical level in the near term.
If Solana holds above $128, the broader structure remains corrective rather than decisively bearish. However, a sustained break below this level would place price under both trend support and recent consolidation lows, which would confirm a short-term downtrend.
Momentum indicators reflect the same pressure. The RSI (14) slipped below 40 during the decline, showing weakening momentum, although it has started to stabilize slightly from oversold territory. That behavior suggests selling intensity has slowed, but it has not yet reversed.
Looking ahead, the market remains focused on whether Solana can defend the $128 area. Holding this level keeps price within its broader upward structure from late 2025.
A breakdown, by contrast, would expose lower support zones near the low-$120s and shift short-term bias firmly lower.
Solana tests long-term demand zone as weekly losses deepen
Solana continued to weaken on the weekly chart, extending its pullback as price revisited a long-standing demand area near $130.
Based on the SOL/USDT weekly chart shared by analyst Kamran Asghar, SOL closed the latest session around $130.60, marking a weekly drop of about 5.3%, or roughly $7.3, from the prior close near $138.
The move added pressure to a market already trending lower since late 2025.
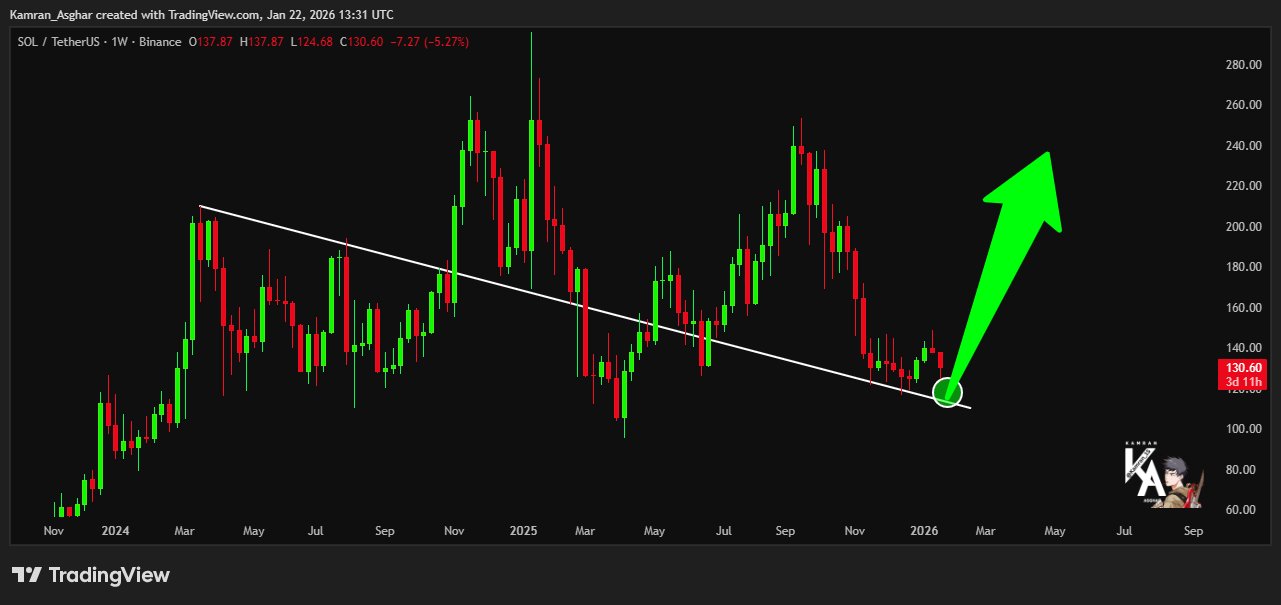
As a result, price now sits directly on a descending trendline that has capped rallies for several months.
This trendline also overlaps with a horizontal demand zone formed during earlier consolidation phases.
Historically, this area has attracted buyers after extended declines, which explains the current focus on whether Solana can hold this level.
So far, the market has not broken decisively below the zone. Candles show smaller bodies and longer wicks near support, signaling that selling momentum is slowing as buyers defend the area.
However, the broader structure remains fragile. SOL continues to trade well below prior weekly highs near $180 and $240, keeping the medium-term trend tilted lower.
If Solana holds above the $130 region and stabilizes along the trendline, the structure supports the case for a relief rebound.
In that scenario, the $150 area becomes the first upside level to watch, as it aligns with prior breakdown zones and former support turned resistance. A move toward that level would still fit within a corrective recovery rather than a full trend reversal.
On the other hand, a clear weekly close below the demand zone would change the setup.
Such a move would place price under both trend support and historical buying interest, opening the door to deeper downside toward the low-$120s.
Until the market resolves this level, Solana remains at a technical inflection point, with short-term direction hinging on whether buyers can defend the current floor.
Disclosure:This article does not contain investment advice or recommendations. Every investment and trading move involves risk, and readers should conduct their own research when making a decision.
Kriptoworld.com accepts no liability for any errors in the articles or for any financial loss resulting from incorrect information.

Tatevik Avetisyan is an editor at Kriptoworld who covers emerging crypto trends, blockchain innovation, and altcoin developments. She is passionate about breaking down complex stories for a global audience and making digital finance more accessible.
📅 Published: January 23, 2026 • 🕓 Last updated: January 23, 2026
